
Intune Debug Toolkit is a community developed solution, maintained by Mattias Melkersen from MSEndpointMgr including community members Oliver Kieselbach (@okieselb), Rudy Ooms (@Mister_MDM) and David Just (@DavidJu14353759), Jannik Reinhard (@jannik_reinhard), Ondrej Šebela (@AndrewZtrhgf), David Segura (@SeguraOSD), Rafał Zimonczyk and Petri Paavola (@petripaavola) aiming at providing better and easier debug possibilities on devices co-managed or Intune managed only.


Prerequisites
In order to use the Intune Debug Toolkit you need to have the device to debug at hand (If you need to debug remote, then use the built-in function in Intune):
- Local administrative rights
- Installation of the tool
- To run
- AUTOPILOT Pre-provisioning Readiness
- AUTOPILOT Readiness
- Debug like Microsoft
- IME Reader
- RERUN Apps Win32
- WUFB Readiness
- Internet Access
- Multiple modules will be installed from PowerShell Gallery.
- Access to Microsoft Intune
- To run Device Details Debug you need to authenticate towards Microsoft Graph.
Download the MSI
Go to the link here and download the MSI


Deploy the Tool
This app has already been prepared for deployment through your favorite deployment system. Grab the MSI and run it with: msiexec /i IntuneDebugToolsvX.msi /q
If you like to deploy it to all of your machines but do not like the shortcuts in the startmenu, it now supports to hide them

If you are not familiar with the process how to add a package to Intune you can always follow this guide. [Intune Operational Tips] – How to work with application management (Win32) in Microsoft Intune – YouTube

The following documentation section will describe the tool and what it will help you with.
DEBUG Enrollment
Anything related to the registry path HKLM\Software\Microsoft\Enrollments will be monitored by this function. If e.g. anything were added/changed during last 36 hours it will be revealed by this function.


DEBUG GPO
Anything related to the registry path HKLM\Software\Policies will be monitored by this function. If e.g. anything were added/changed during last 36 hours it will be revealed by this function. If you are running Co-managed and hybrid Azure AD Joined, it will be nice to know if anyone in your organisation added new GPO’s that might interfer with your current path with Intune policies.


DEBUG Intune Management Extension
Anything related to the registry path HKLM\Software\Microsoft\IntuneManagementExtension will be monitored by this function. If e.g. anything were added/changed during last 36 hours it will be revealed by this function. Sensor, SideCarPolicies, Inventory and much more.


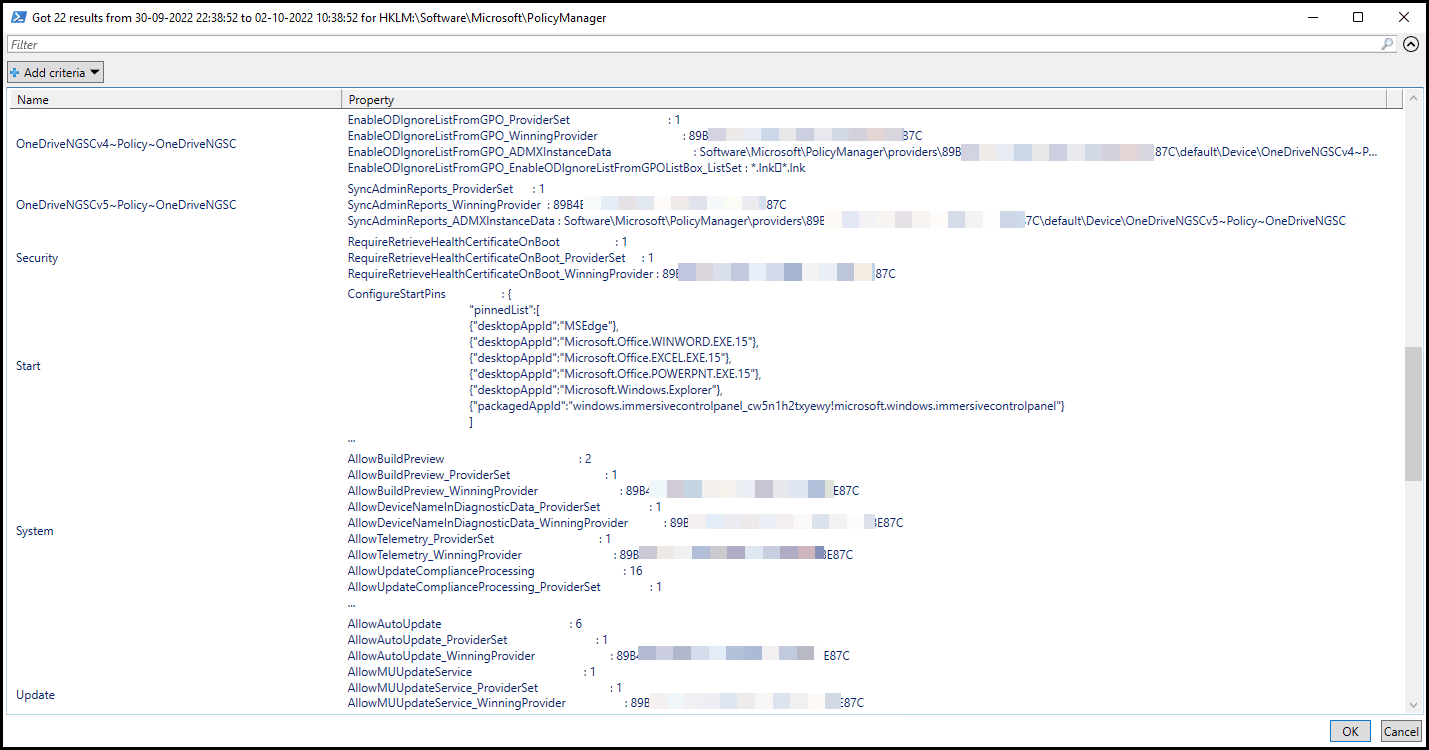
DEBUG PolicyManager
Anything related to the registry path HKLM\Software\Microsoft\PolicyManager will be monitored by this function. If e.g. anything were added/changed during last 36 hours it will be revealed by this function. Intune does write most of its policies locally on device here. This is a good place to be able to debug e.g. error code 65000.

AUTOPILOT Pre-provisioning Readiness (Run as Admin)

Ever experienced problems with Autopilot Pre-provisioned devices? This function will go in-depth to tell you if the pre-requisites are meet and what you might be missing on a device to fullfill the requirements. Issues with the EKCert, missing connection to propper endpoint or the TPM maybe?

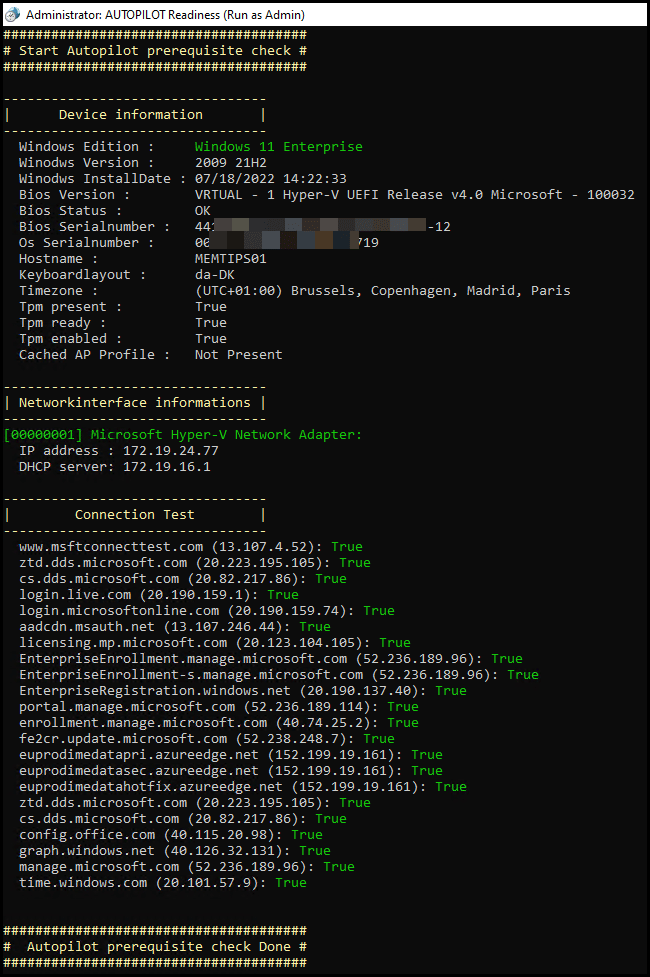
AUTOPILOT Readiness (Run as Admin)

Ever experienced problems with Autopilot in general? Then you might want to check the pre-requisites are in place before proceeding. This function will help you determine if the correct endpoint are open and will be able to communicate.
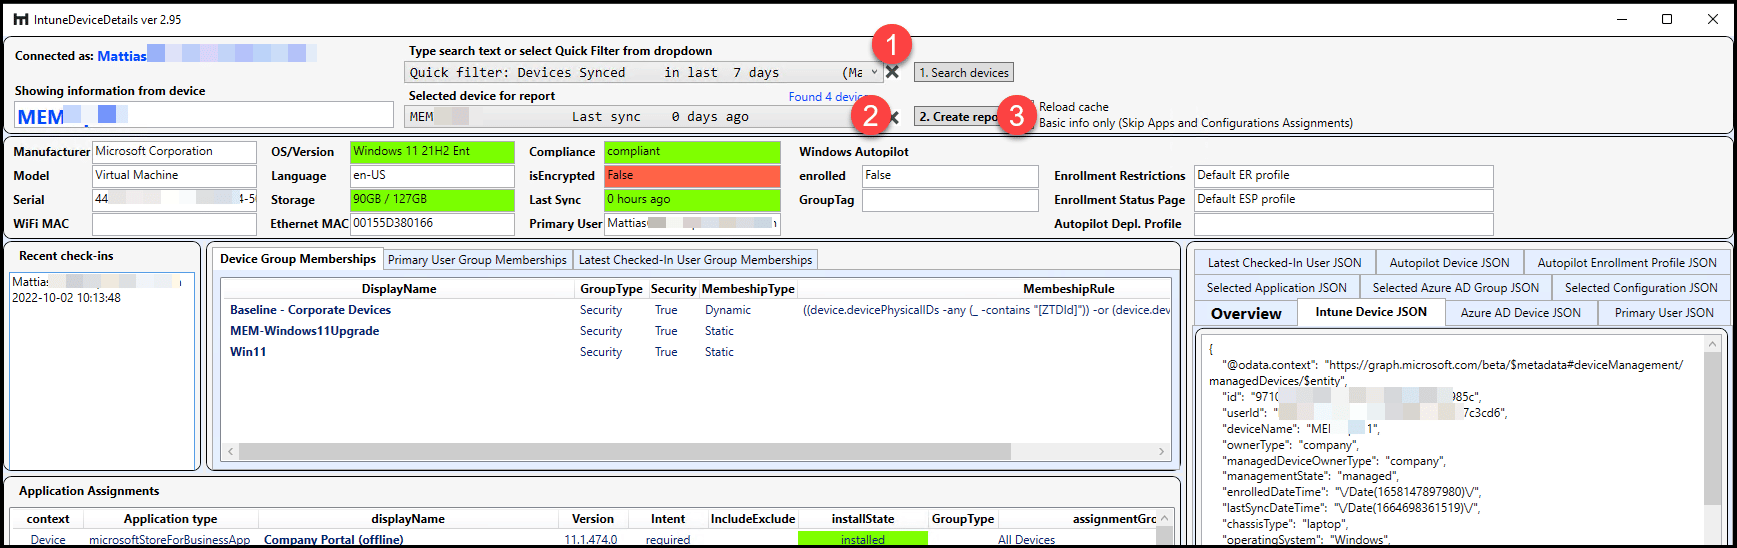
DEVICE Details Debug (Requires authentication)

This function provides a complete overview of your device. You will be able to see all data around the device and the user using the device. Wether you like to see recent check-ins, application assignments, Configurations Assignments or just see Device Group memberships, this is the function to use!


DIAGNOSTIC Data

Have you ever created a Microsoft ticket and needed to send them a diagnostic report the device? It has never been easier.

ERRORCODES and Solutions

If you ever come across an error and wondered why this happened or how to solve it, this is a living document that will keep track on errors, why they happen and how to solve them.


MDM eventlog monitor

Eventlog usually reveal what happens in the background while Intune adds policies or other stuff to the device, but where should we look? This function provides a live eventlog debug trace where you will be presented with color codes to easy find the errors or warnings in between the load of informations. When you close it you can always find the trace in a log. The location of that is revealed in the top bar of the function.

Monitor Sync Data Live

If you like to better understand the stream that goes from Intune to your device, this is the tool to use. It will reveal any changes to the system while syncing, if it is adding, removing or simply updating policies. Do you need to know how to rollback a configuration? Then a trick could be to view the sync process while unassigning a policy and you will know if it rollback the policy to default or it will be tatooed on the client.

OVERVIEW of assigned policies (RSOP)

When debugging group policies, many IT Pros are familiar with the GPResult command and view the report afterwards. This is not possible with Intune managed devices. However this function come close to some similar experience. It will look through all of the configurations and tell you wether it is Intune or GPO that is the winning provider of this policy.
RERUN Apps Win32 (Run as admin)

Application debugging is never fun if it already were uploaded to Intune. If you added the wrong detection method, it will fail hard and you would like to change that and rerun it right away. With this function you can force the app to rerun faster than the normal schedule which is a check happening every 24 hour.
You will also be able to see the install/uninstall command, detection method and much more.


VIEW Proactive Remediation Scripts

This function will help you view ProActive Remediation scripts that is targetted a device. You can simply do this from the Intune portal as well, but it is not as easy as doing this.


WUFB Readiness

It can be hard to tell where update are coming from. Especially in a transition period where you change from WSUS to Windows Update for Business. This function will help you determine where updates comes from and when they applied. Also where Microsoft 365 apps for enterprise are looking for updates and when it last checked for patches.


Debug Autopilot (use during provisioning)

When you go through Autopilot and the 3 known phases, it can be very hard to tell what exactly happens beneath the surface. With this helpful tool, you well get a easy headstart to see exactly what is applying of scripts and packages during device ESP and user ESP


Debug with eventlog (use during provisioning)

Eventlog usually reveal what happens in the background while Intune adds policies or other stuff to the device, but where should we look? This function provides a live eventlog debug trace where you will be presented with color codes to easy find the errors or warnings in between the load of informations. When you close it you can always find the trace in a log. The location of that is revealed in the top bar of the function.


Debug like Microsoft

I bet that most of you never have seen this one as it has been secretly hosted on a Microsoft Github. This function will give you deep log gathering from your system and you will never wish for more data again. Try it OUT!


IME Reader

IME reader is the greatest tool around to read Intune Management extension. It’s written by Petri and it is super awesome to search for specific areas of the IME log.


CMTrace

CMTrace has been around for ages debugging in log files but no longer available to download as a standalone. You can grab it from the binaries of a client that has the configuration manager client installed.

Import device as corporate (ADE)

This tool is build by a cool guy Rafal.
Introducing Our New Tool: Simplify Device Management with Ease
Managing devices just got a whole lot easier with our latest tool! Here’s what it can do for you:
- Quickly Identify and Upload Device Information to Intune: Our tool can swiftly identify and upload your device’s serial number directly to Intune via Graph API. If you don’t have the necessary permissions, no worries! You can easily export the information into a file and send it to your IT admin.
- Ensure Your Device is Up-to-Date: Stay on top of the latest Windows OS builds with our tool’s update feature. It allows you to quickly update your device, ensuring you are always running the latest version of Windows.
Give it a try and experience seamless device management!

Source code repositories
Intune Debug Toolkit source code can be found at the following locations:
- Is this tool free?
- Yes, it’s licensed under the MIT license and a compilation of many other great contributors in the community. (all contributors can be found on the overview page or in the change log on GitHub)
- Can I debug remote on clients?
- No. This tool is meant to be used while having the device within reach. If you need to debug on a computer that is not available physically then use the built-in debug function in Intune and gather logs.
- How will Intune Debug Toolkit be updated?
- I have communication going on with all the stakeholders and I do very much care for the tool works as expected. If any bugs needs to be reported, please do so, and please also give feedback if you think you need more or better insights.
- Is there any support for Intune Debug Toolkit provided by the developers?
- This is community based and will not have any kind of support. Be welcome to reach out, but no one of the developers will be obligated to help free of charge.
- How do I report an issue with Intune Debug Toolkit?
- We prefer that bugs are reported on the official repository. Links are provided in the Source section.