

We wanted to have more details and ability to search across our entire estate of apps and devices in Intune and decided to Enhance Intune Inventory data by creating a custom data collector using a PowerShell script to gather data from all our devices using Proactive Remediations. The native logging in Intune is continuously improving , but we still see need for enhanced custom inventory in many cases.
What is Log Analytics?
Log Analytics used to be a service in Operation Management Suite (OMS), retirement of OMS brand was announced in April 2018 and start moving into Azure Monitor. In February 2019, Log Analytics, Log Analytics workspaces, and Management solutions became part of Azure monitor components, and OMS portal has been officially retired on May 15, 2019.
Log Analytics is a tool in Azure, used to edit and run log queries with data in Azure Monitor logs. We can write a simple query that return a set of records, and we can use more advanced KQL query language to analyze and return data that match our particular requirements. Besides running log queries, we can also collector our own data as custom logs, create beautiful workbooks, and integrated with alerts and advance automation, for example Logic Apps.
Custom Logs
Azure Monitor HTTP Data Collector API is currently in public preview, we can use the HTTP Data Collector API to send log data to a Log Analytics workspace in Azure Monitor from any client that can call a REST API. In our scenario, we want our Windows 10 clients to send device and application inventory data to Log Analytics workspace. What we need here is a PowerShell script to collect the data locally on the devices, and then a Log Analytics workspace to send the data to. It is strongly recommended that all Intune logs from the Diagnostics tabs also is enabled and forwarded to the same log workspace in Azure.
The Log Workspace setup
We are not going into details on how to setup the log workspace itself, but there is 2 parameters we need from the workspace for this solution to work.
- Workspace ID
- Shared Key
These 2 values can be found under Agents management in the Log Analytics workspace:

The script
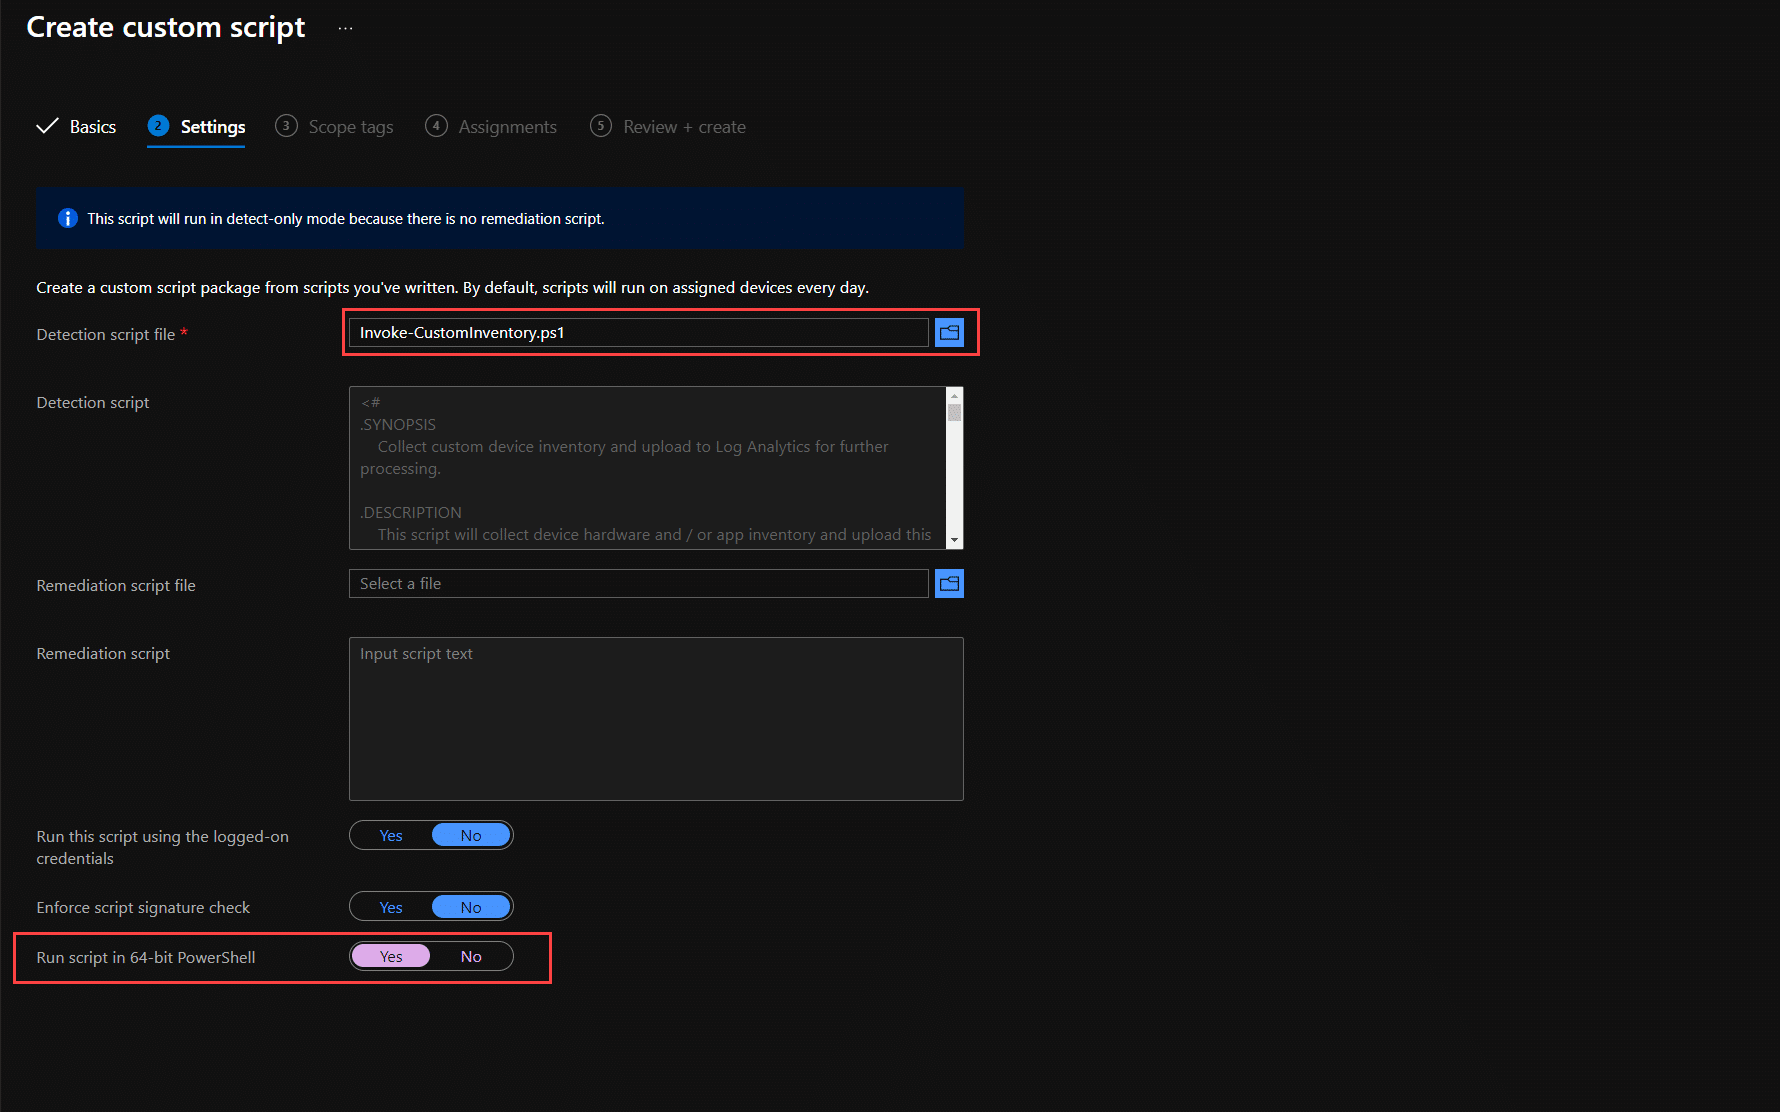
The script Invoke-CustomInventory.ps1 will by default collect both the defined inventory of devices and apps. If you only want to collect one of them, you need to change the variables in the initialize region where you also need to add your 2 values for your workspace:
#region initialize
# Enable TLS 1.2 support
[Net.ServicePointManager]::SecurityProtocol = [Net.SecurityProtocolType]::Tls12
# Replace with your Log Analytics Workspace ID
$CustomerId = ""

# Replace with your Primary Key
$SharedKey = ""

#Control if you want to collect App or Device Inventory or both (True = Collect)
$CollectAppInventory = $true
$CollectDeviceInventory = $true

# You can use an optional field to specify the timestamp from the data. If the time field is not specified, Azure Monitor assumes the time is the message ingestion time
# DO NOT DELETE THIS VARIABLE. Recommened keep this blank.
$TimeStampField = ""

#endregion initialize
The full script is available at this location: Github
Inventory script is updated to a newer version to support BIOS Update compliance among other new additions. We do also not collect computer location information anymore for privacy reasons.
Running the Script
We recommend using Endpoint Analytics – Proactive Remediations for this, but if that is not an option, you can also run this as a scheduled task on your computers. We recommend 1 daily run of the inventory script.
Go to the Endpoint Analytics blade in Endpoint Manager admin center and click on Proactive remediations. Here you click on Create script Package.
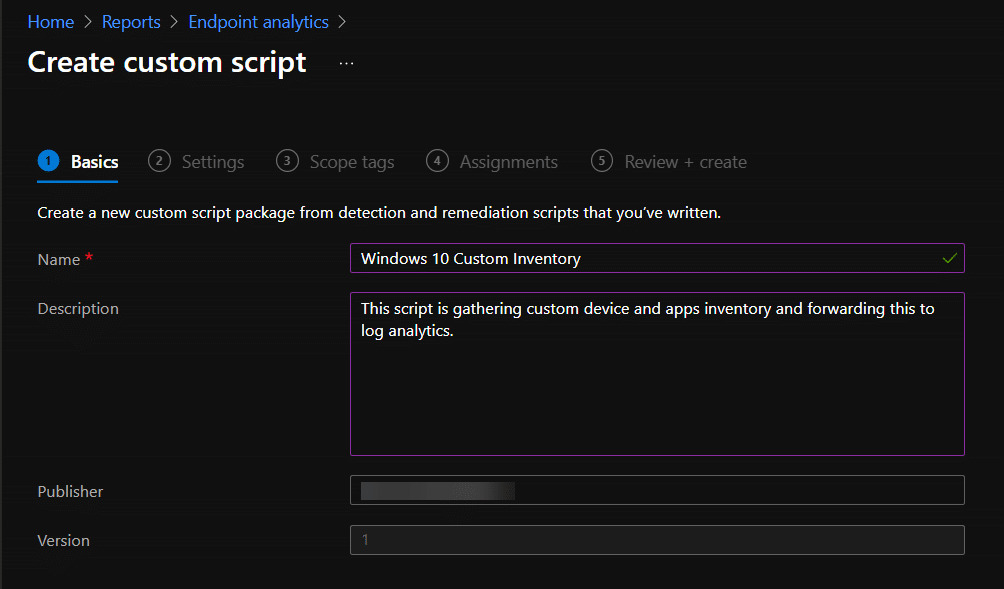
Now make sure you have updated the script with your own workplaceID and SharedKey before you upload the file to Intune.
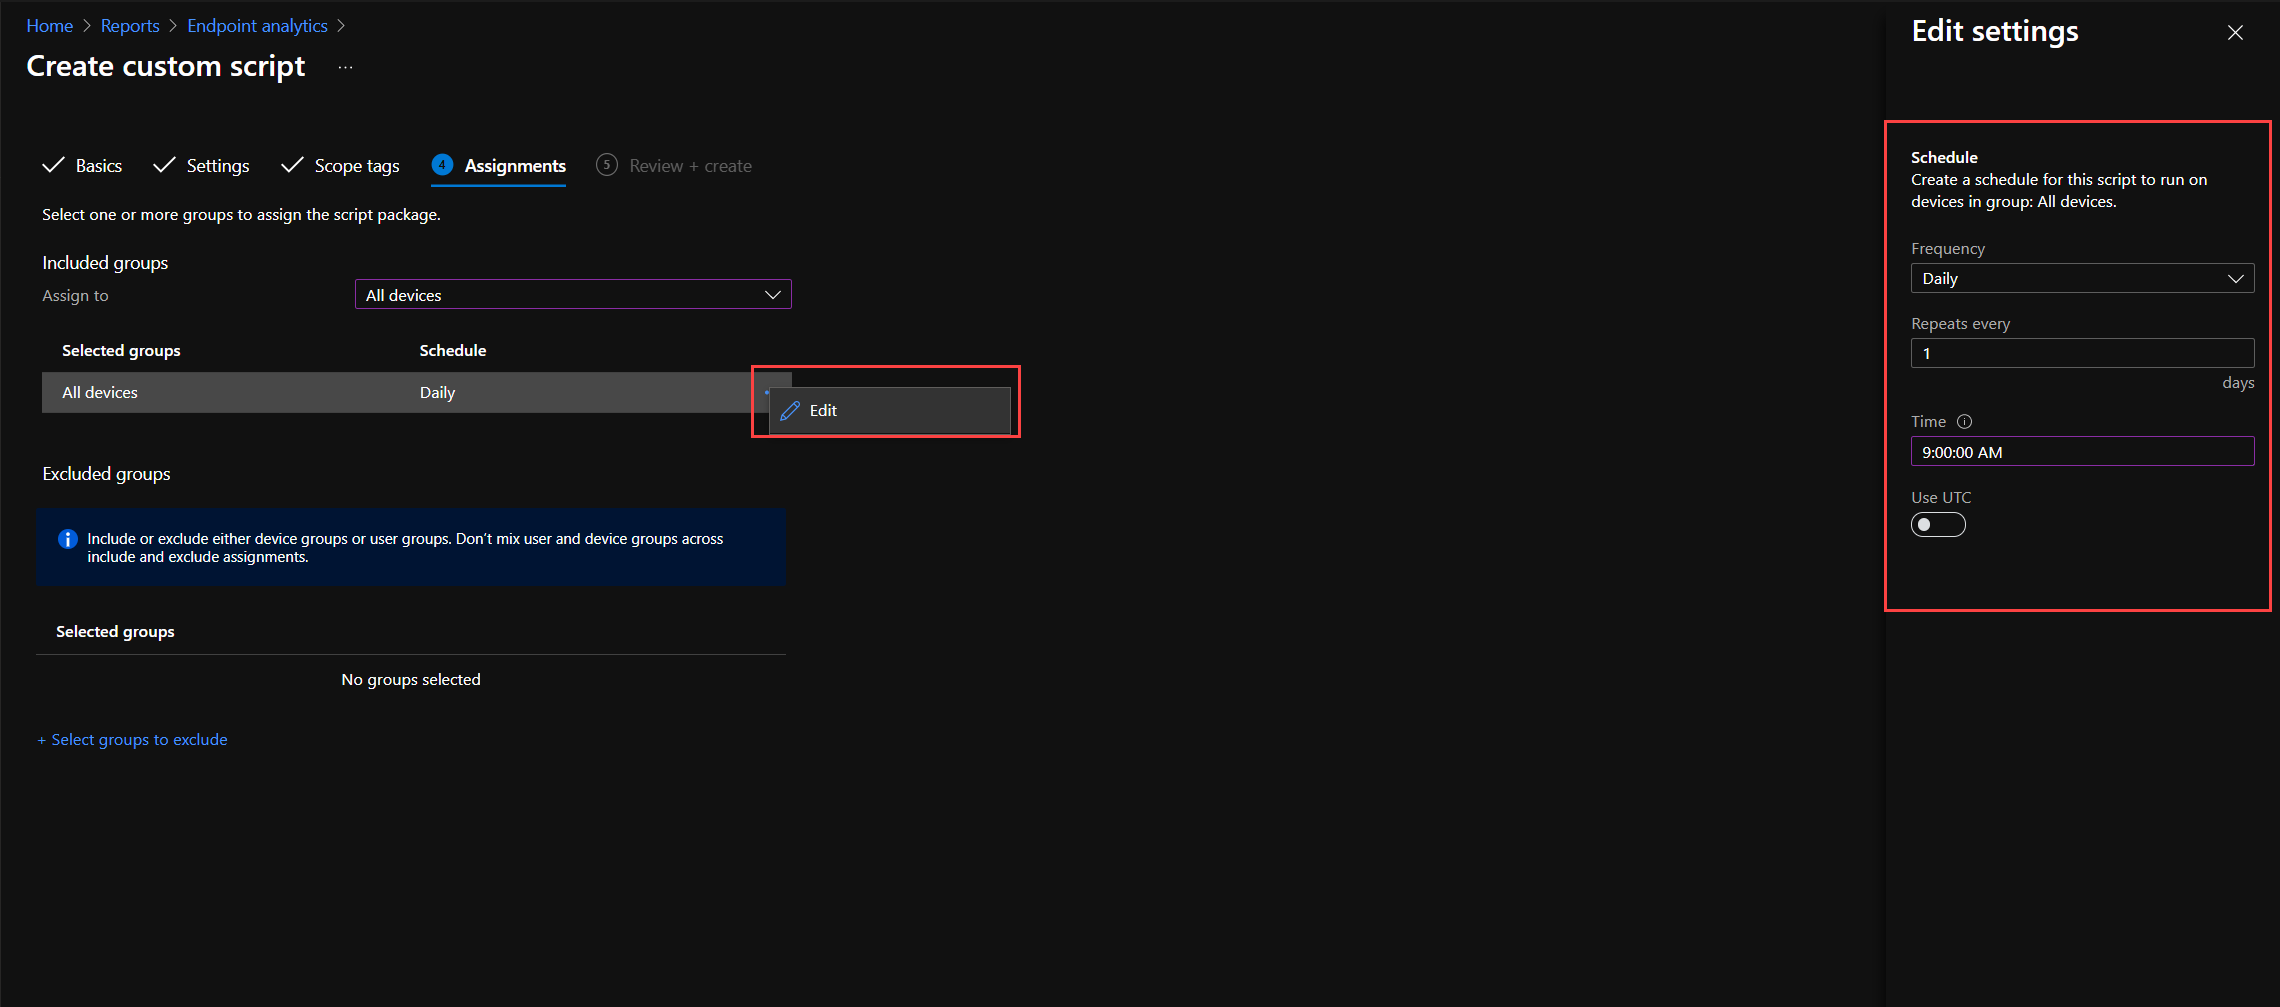
Click next on Scope tags, and go to Assignments. Here you can either choose all devices, or just a group of devices you want to start testing on. We recommend using device groups for this. Remember to verify the schedule. I run this every morning at 09:00 AM on all devices.
Now continue through and create the script package.
Monitor script execution
To verify that the script is running and actually publishing data to your workspace, use the Overview blade on your script package.
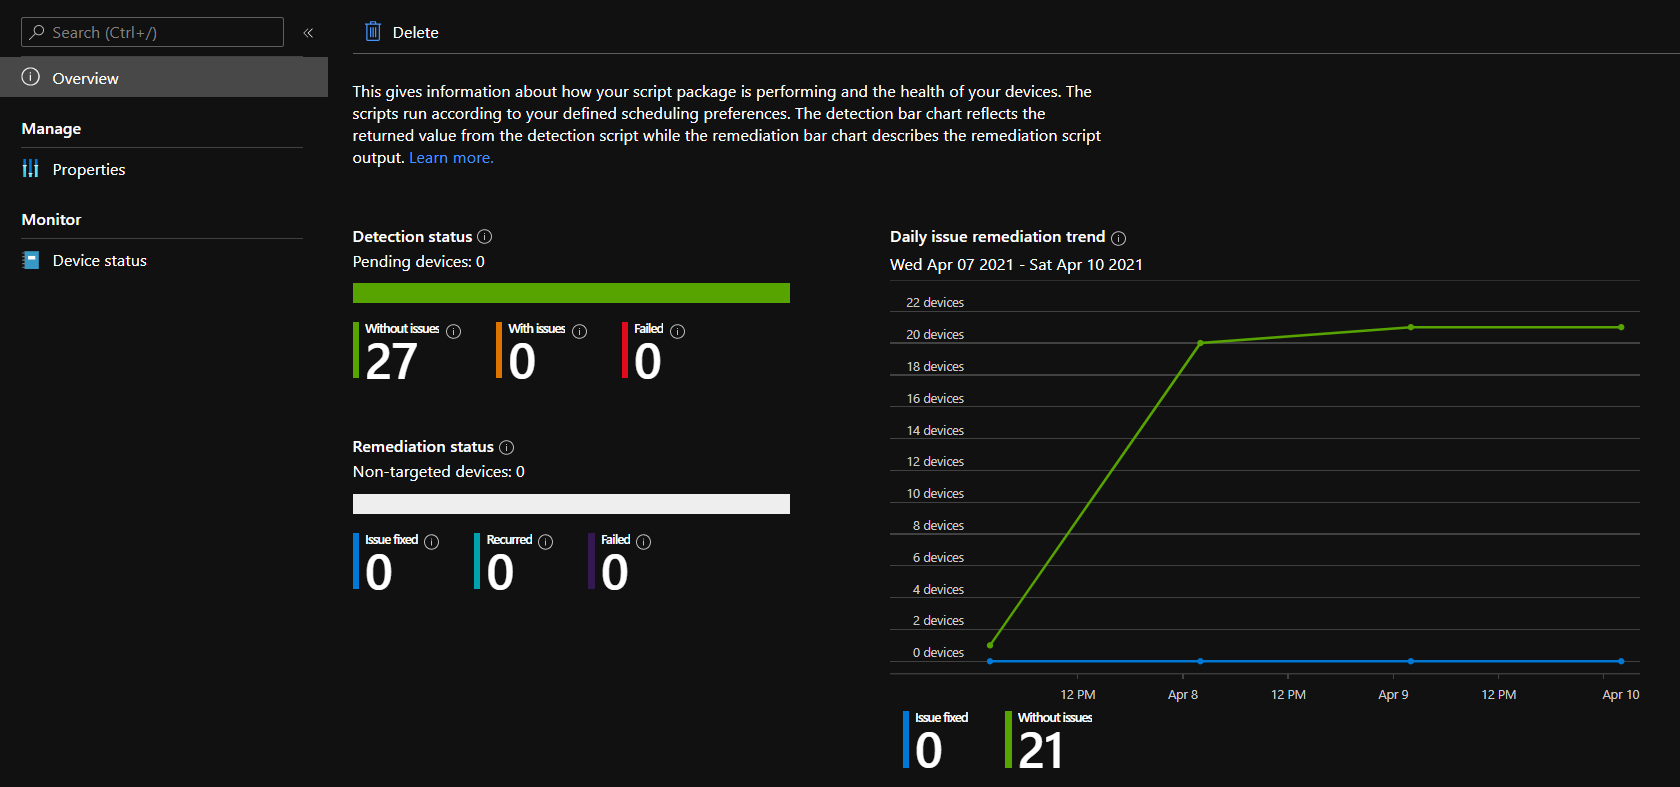
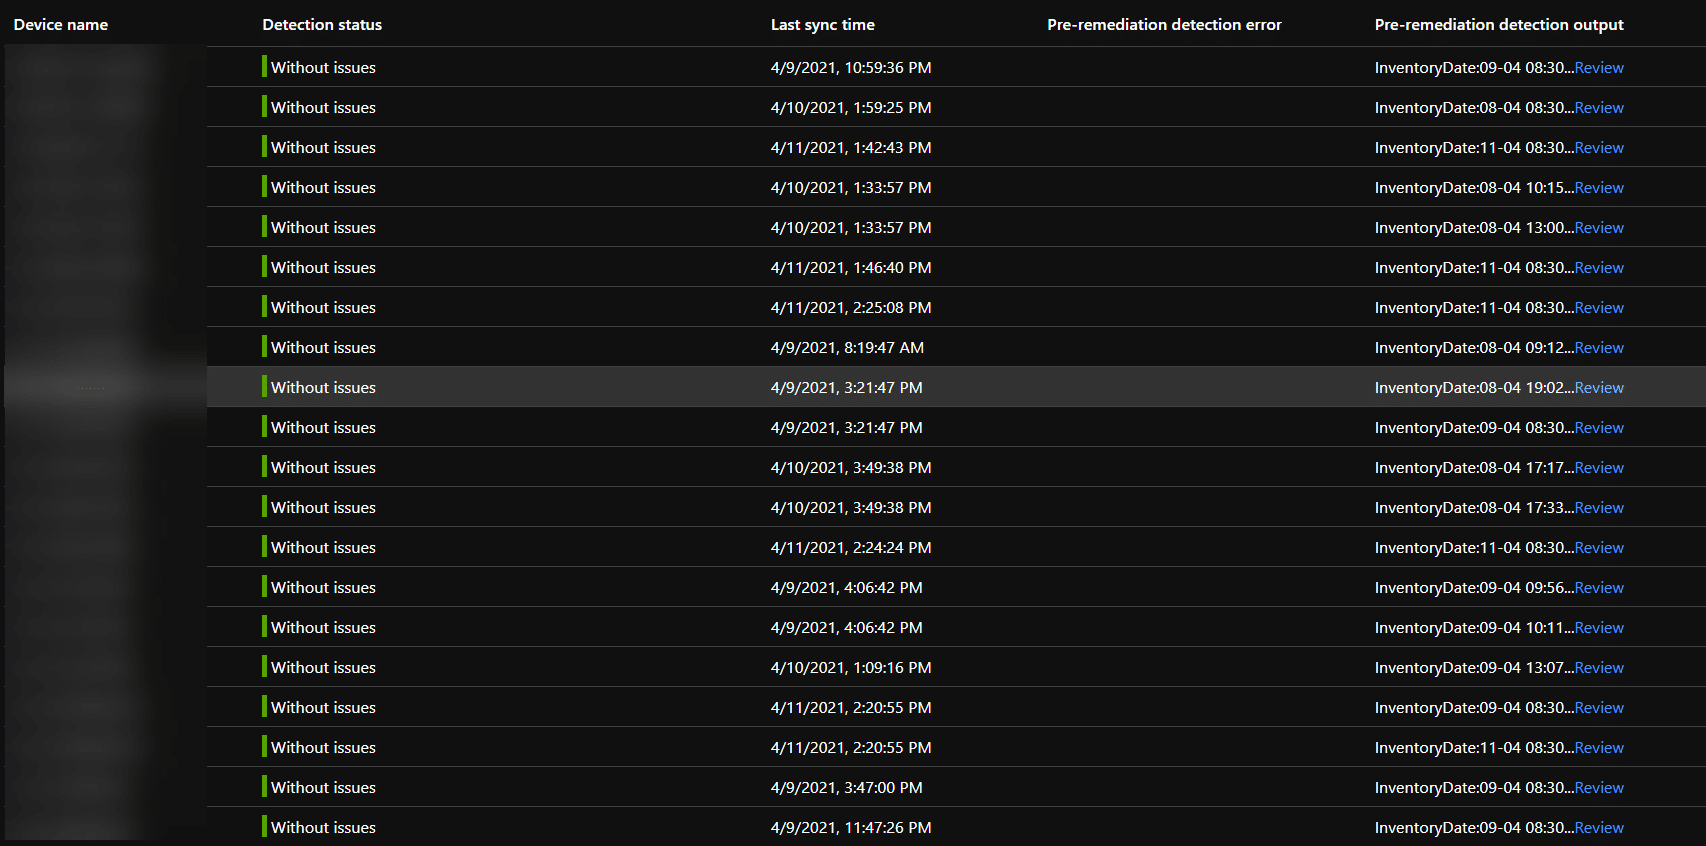
Now this all looks good, we don’t see any errors on the overview page. But let us take a deeper look, and go to the Device status blade. We are only interested in Device name, Detection status, sync time, Pre-remediation detection error (This is where you will see script errors) and Pre-remediation detection output.
And lets have a look at the details of the output by clicking on Review (in blue) on one of the entries.
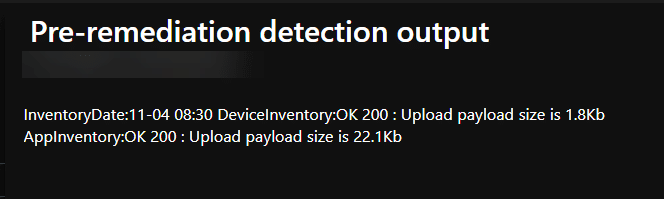
What we see here is that both Inventories have been uploaded OK to Log Analytics. Return code 200. And that the Device inventory size is 1.8Kb and the App Inventory is 22.1Kb. This will give you a pointer to the cost of this setup in your environment. Device Inventory will be pretty static in size, while App inventory size is driven by the number of apps on your devices.
Reports
So the reason for this is to extend the inventory beyond what we get natively in Intune and allow us to easily search through it. We have some examples of queries and workbooks in the github repository here
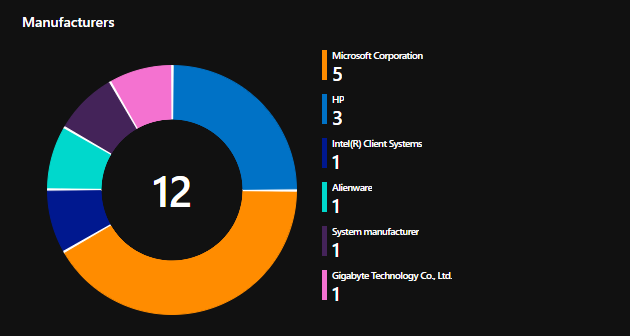
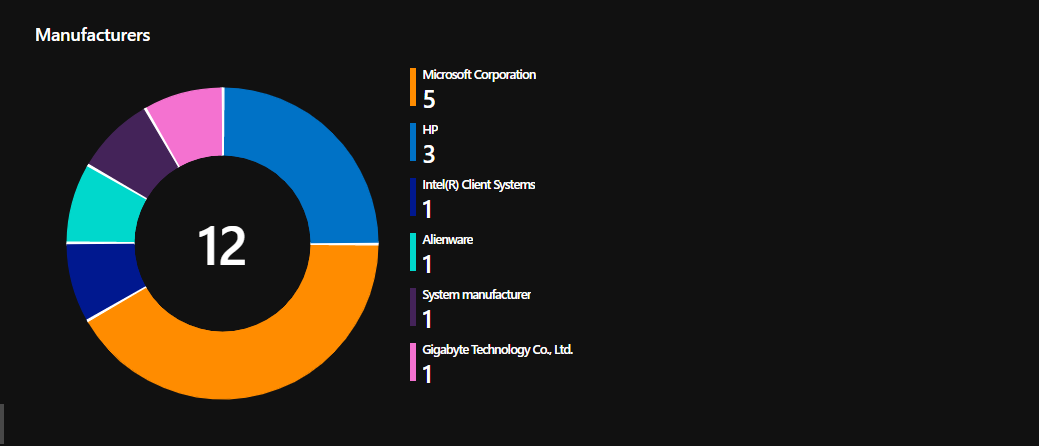
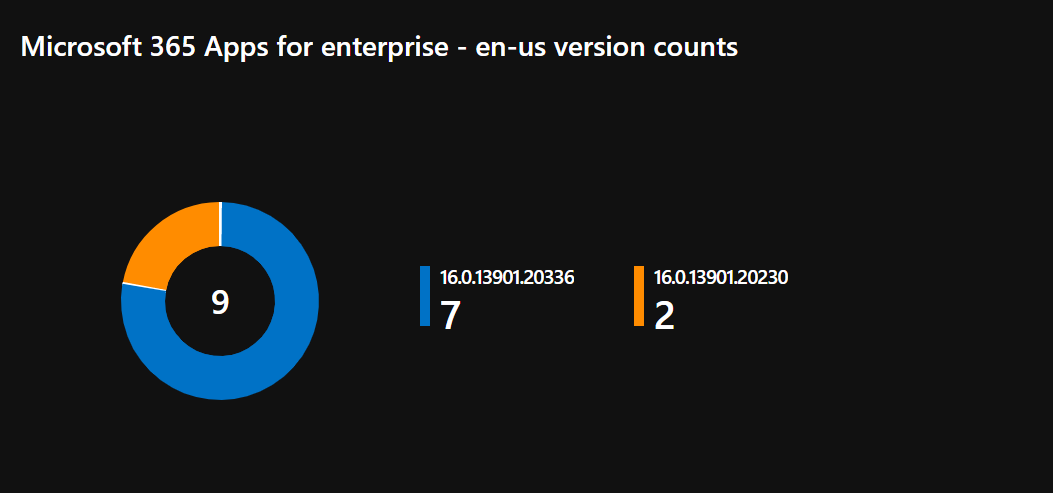
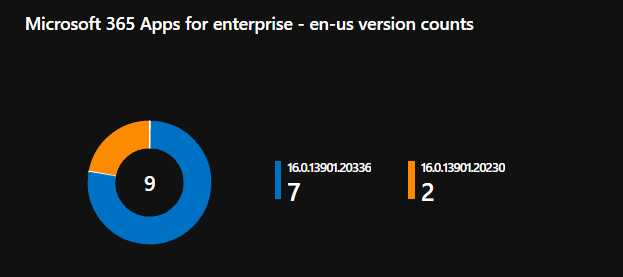
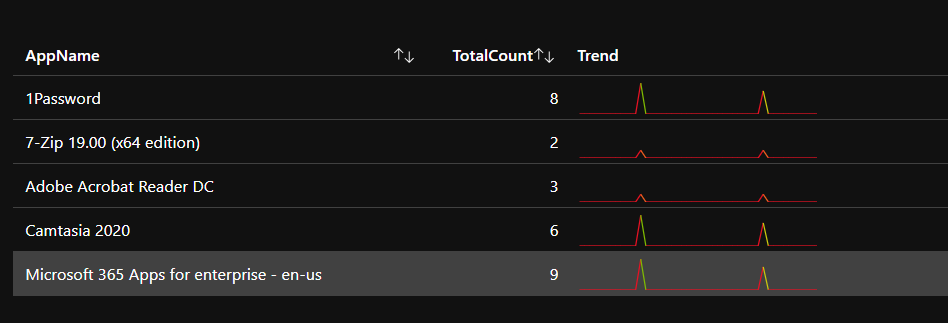
Some examples screenshot’s from the workbooks:
What data is collected?
DeviceInventory
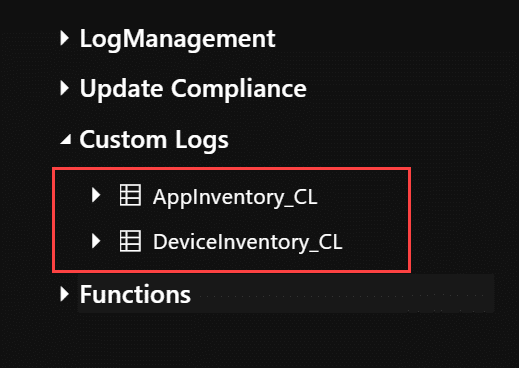
Device Inventory is found in the Custom Log DeviceInventory_CL
- TenantId
- SourceSystem
- TimeGenerated
- InstallDate_s
- ManagedDeviceID_g
- WindowsVersion_s
- Manufacturer_s
- BitlockerVolumeStatus_s
- OSRevision_s
- SMBIOSUUID_g
- SystemSKU_s
- SystemSkuNumber_s
- NetworkAdapters_s [Array]
- MacAddress
- NetIPv4Adress
- NetIPv4DefaultGateway
- NetInterfaceAlias
- NetInterfaceDescription
- NetProfileName
- TPMEnabled_s
- OSName_s
- ComputerUpTime_s
- ManagedDeviceName_s
- DefaultAUService_s
- OSBuild_s
- SerialNumber_s
- CPUName_s
- TPMPresent_s
- BitlockerCipher_s
- TPMActived_s
- CPUManufacturer_s
- AzureADDeviceID_g
- DiskHealth_s [Array]
- Disk 0 Read Errors
- Disk 0 ReadErrorsTotal
- Disk 0 ReadErrorsUncorrected
- Disk 0 Temperature Delta
- Disk 0 WriteErrorsTotal
- Disk 0 WriteErrorsUncorrected
- Disk Number
- Disk Wear
- FriendlyName
- HealthStatus
- MediaType
- BiosDate_s
- TPMReady_s
- ComputerName_s
- FirmwareType_s
- PCSystemType_s
- TPMThumbprint_s
- AUMetered_s
- LastBoot_s
- BitlockerProtectionStatus_s
- CPULogical_s
- Memory_s
- CPUCores_s
- BiosVersion_s
- Model_s
- PCSystemTypeEx_s
App Inventory
App Inventory is found in the Custom Log AppInventory_CL. We collect the following information about all apps detected on the device (System and current user)
- TenantId
- SourceSystem
- TimeGenerated
- AzureADDeviceID_g
- ComputerName_s
- AppName_s
- AppUninstallRegPath_s
- AppVersion_s
- AppPublisher_s
- AppUninstallString_s
Feedback
If you have any suggestion or feedback to workbooks or the script, feel free to comment here or in github. If you have any modification or add-on please feel free to do a pull request in github as well.


I’m not understanding workbooks, both sample require parameters like device or app ID?
This query could not run because some parameters are not set.
Please set: DeviceName
Please set: Applications, Device, M365TimeRange
How do I get summary report of the ingested data?
Will all these steps and posts be updated since MS is retiring much of Log Analytics for Azure Monitor?
Jan,
Was the updated workbook ever released? I know the original workbook had some bugs. BTW, we still use these Proactive Remediation scripts, which work as a treat.
Hi,
how can I add a custom key registry for example to check for in the script?
Thanks
Hi
how can I add some information for example the value of a registry key?
Thanks
I have this up and running since months ago but it´s not working fine for me, and I don´t know why.
The script is running on all our computers (82K), all showing “AppInventory:OK 200”, but most of them are also reporting an error;
Exception calling “GetBytes” with “1” argument(s): “Array cannot be null.
Parameter name: chars”
At C:\WINDOWS\IMECache\HealthScripts\37e41009-7374-411a-a06c-e4b385945662_5\detect.ps1:546 char:1
+ $ResponseDeviceInventory = Send-LogAnalyticsData -customerId $custome …
+ ~~~~~~~~~~~~~~~~~~~~~~~~~~~~~~~~~~~~~~~~~~~~~~~~~~~~~~~~~~~~~~~~~~~~~
+ CategoryInfo : NotSpecified: (:) [], MethodInvocationException
+ FullyQualifiedErrorId : ArgumentNullException
Checking AppInventory_CL I see all our computers are saving data there but it´s incomplete an a lot of applications are missed.
Any idea or suggestion? Thanks a lot.
I successfully uploaded script and ran proactive remediation. But getting error when i run the Device Inventory.workbook. It says device name is not set. Can you guide me if any edit we have to do for Device Inventory.workbook and then we have to execute the workbook?
Thanks
Narayanan
It’s 2 years on from this article – is this still the best/only way of creating a group of machines that e.g. have a particular piece of software installed for use by Intune?
Thanks
Martin
Hi,
I’m using the workbook “Application inventory” but when I try to select an APP it doesn’t show me all of them, if I look inside the table “AppInventory_CL” the application exists, it seems as if the search box is limited .
I just got added on to a subscription to use this and I have the remediation deployed but when I tried to add the workbook I get the message below when I paste the sample workbook from your GitHub json. I’m probably missing something simple but I have been going through Workbook guides online and watching videos on it and can’t figure it out.
This query could not run because some parameters are not set.
Please set: DeviceName
How do we see the data? I have the AppInventory_CL showing under Custom Logs, but what next?
is there any KQL query to obtain the data for unique computers (if there are multiple tke the recent one)
Is there a way to add inventory for TPM version to this or is it there and I just missed it? I am trying to create a dynamic group for devices with TPM 2.0 enabled so I can assign a self deploying autopilot profile to compatible devices.
I’m running into an issue with the workbooks. The code has been copy/pasted directly from GitHub. The Hardware Inventory Report section for example is completely empty but I can see computers under the Operating System Trend and info under the App Inventory Report. Any advice on what to check?
Thank you for create such useful way to collect custom data from endpoint, I have made a quick change to add Driver version and date information from network adapters.
Hi
Thanks for all the work on this, me and my team are finding this info useful.
On the Application Inventory workbook, under the application report section, the applications drop-down is limited. Is this a workbook limit or a log analytics limit?
https://imgur.com/a/H7J2Mzq
Thanks
Matt
Is there a way to update the script to collect device driver information as well such as driver name, manufacturer, version, description, etc?
This script below is able to display the required information
Get-WmiObject Win32_PnPSignedDriver| select DeviceName, DriverVersion, Manufacturer, Description
However, am looking for a way for this information to get stored in Log Analytics and have a workbook created for it.
Any help?
Great work! Would you happen to you have an updated proactive remediation script that uses a function app?
Hi,
This is an awesome report. Thanks for sharing!
Is there any way to improve the application picker experience? We have more than 1K (which I think is the limit for dropdown. Is there a search bar that shows you the options containing the text you are typing or something like that?
Any suggestions?
Thanks.,
I was just curious if this was the latest blog about this topic? This looks pretty cool, but want to make sure I configure it with no bugs in play. Thank you for this tool, this looks awesome.
Fantastic work gents, super helpful!
Unfortunately where i work there is a culture of closing laptop lid = shut down resulting in many devices showing miraculous uptimes of 30 days + is there a way we can enforce this with a toast notification to inform the user? say device has been up x days enforce a shut down with prompt to end user?
I’m needing to get the cipher information that Bitlocker is using. I noticed that while the majority of the information is uploaded, it would not return Bitlocker information (cipher, status, protection) in my Workspace.
I noticed on line 319, that you are doing a “| Select-Object -Property *”. I changed this to “select *” on my test devices. After doing this, my Workspace now shows that information. Before I make that change in my environment, I wanted to make sure there was a reason for using the -property that I am not seeing.
I get “The query returned no results” on “Storage Status” and “Device Inventory Details” when I run the Device Inventory workbook.
I’m running the “Invoke-CustomInventory.ps1” script as Proactive Remediations, and everything besides those two topics are showing results as expected (both in application and device inventory).
Any tips or clues?
With sample workbooks I get:
No Log Analytics workspace resources are selected. Please select Log Analytics workspace.
and do not see where to add this parameter
Hi
Thanks for this solution. it works great but I am running into an issue where data in Applications list dropdown is truncated. I only see applications list upto “M” letter sorted alphabetically. I was looing for “Zoom” application but wasnt able to find it in list
If i pull installed applications per device, then i can see zoom being listed
Is this some type of field limit?
Do you have a guide on configuring the workbook parameters and getting rid of this error?
“It should exactly match with one of the allowed audiences ‘https://management.core.windows.net/’,’https://management.core.windows.net’,’https://management.azure.com/’,’https://management.azure.c…
Awesome blogpost…really useful. But shouldn’t this line go outside the foreach loop?
[System.Collections.ArrayList]$DiskHealthArrayList = $DiskArray
I have several locations worldwide and local admins should only see “their” devices.. Do i need to create a dedicated Log Analytics Workspace for every location?
Thanks for the great blog article and sharing the script and workbooks.
However, for the Device Inventory Workbook, under the “Device Inventory Summarize” item, I get the following error messages:
Operator ‘project’: scalar expression named ‘BiosVersion_s’ could not be resolved….
Operator ‘where’: Scalar expression named ‘ComputerCountry_s’ could not be resolved…
However, the fields are present in the table and also filled with corresponding data. I could not find any other error. Do you have any idea what the problem could be?
Thanks a lot
Kim
Hi, the inventory script and reports your guys are building are amazing… I have an error tho on the Device Inventiry report,
“‘project’ operator: Failed to resolve scalar expression named ‘NetInterfaceDescription_s’…”
and
“‘where’ operator: Failed to resolve scalar expression named ‘ComputerCountry_s’…”
Is there any new version of the Workbooks with corretions that i don’t find?
Rgds
/J
Is there a specific reason for setting the payload limit?
Thats a limitation of the API itself.
https://docs.microsoft.com/en-us/azure/azure-monitor/logs/data-collector-api#data-limits
I’m running into a issue regarding the app inventory, i think its exceeding the cap limit. Is there a specific reason that payload size is set to 32 mb?
https://docs.microsoft.com/en-us/azure/azure-monitor/logs/data-collector-api#data-limits
Thanks for sharing this article, I dont get why this isn’t yet in intune. This is crucial information that you need for reporting about the environment. It seems that Microsoft is not willing to provide this…
Anyhow, I have a question about the workbook in the github repo.
I am a beginner in KQL and I am getting issues with the Device Inventory workbook. The networkadapters field is being recognized as a string and therefore I am unable to project the sub key and value pair. Any idea how to address this?
The current workbook has some bugs. A new one will be released soon.
The device inventory details query returned no results, is there a newer version available where this is fixed?
Great work by the way!
Hi, I am having problems getting the script to download using proactive remediations. Other PR are downloading successfully so I’m not sure why. When I run the script manually on the device it does ingest data to the LAW, but I can’t get the workbook to run at all. Can you expand on how to setup the workbooks?
How do you avoid having the shared key for the Log Analytics workspace in plain text on the PCs? My understanding is that the PowerShell script is left on the PC after it runs, so it’s accessible to anyone with access to the folder it resides in.
In the current version local administrative users can see the sharedkey in the IMECache. Solution is in the works, but will require more azure services to be used.
Any update on this?