


With companies around the world co-managing devices and tenant attaching their devices, one thing I keep hearing from customers is how can we create our own reports and/or dashboards to facilitate the things that are important to me as an admin, or for those in management who need to see what is happening.
This question would have been solved in the past through custom SSRS reports or even PowerBI if you wanted to add some visualisation magic to reports and make them readily accessible to others. With devices now being in a mix of on-premises and in-cloud management states, this poses a bit more of a challenge.. or does it?
Log Analytics and Update Compliance FTW
In this post we are going to look at how we can use Log Analytics and Update Compliance to go beyond the native reporting in Intune or indeed Configuration Manager, and create a fully custom Windows Update dashboard.
To wet your appetite, lets just say we wanted to know about the following;
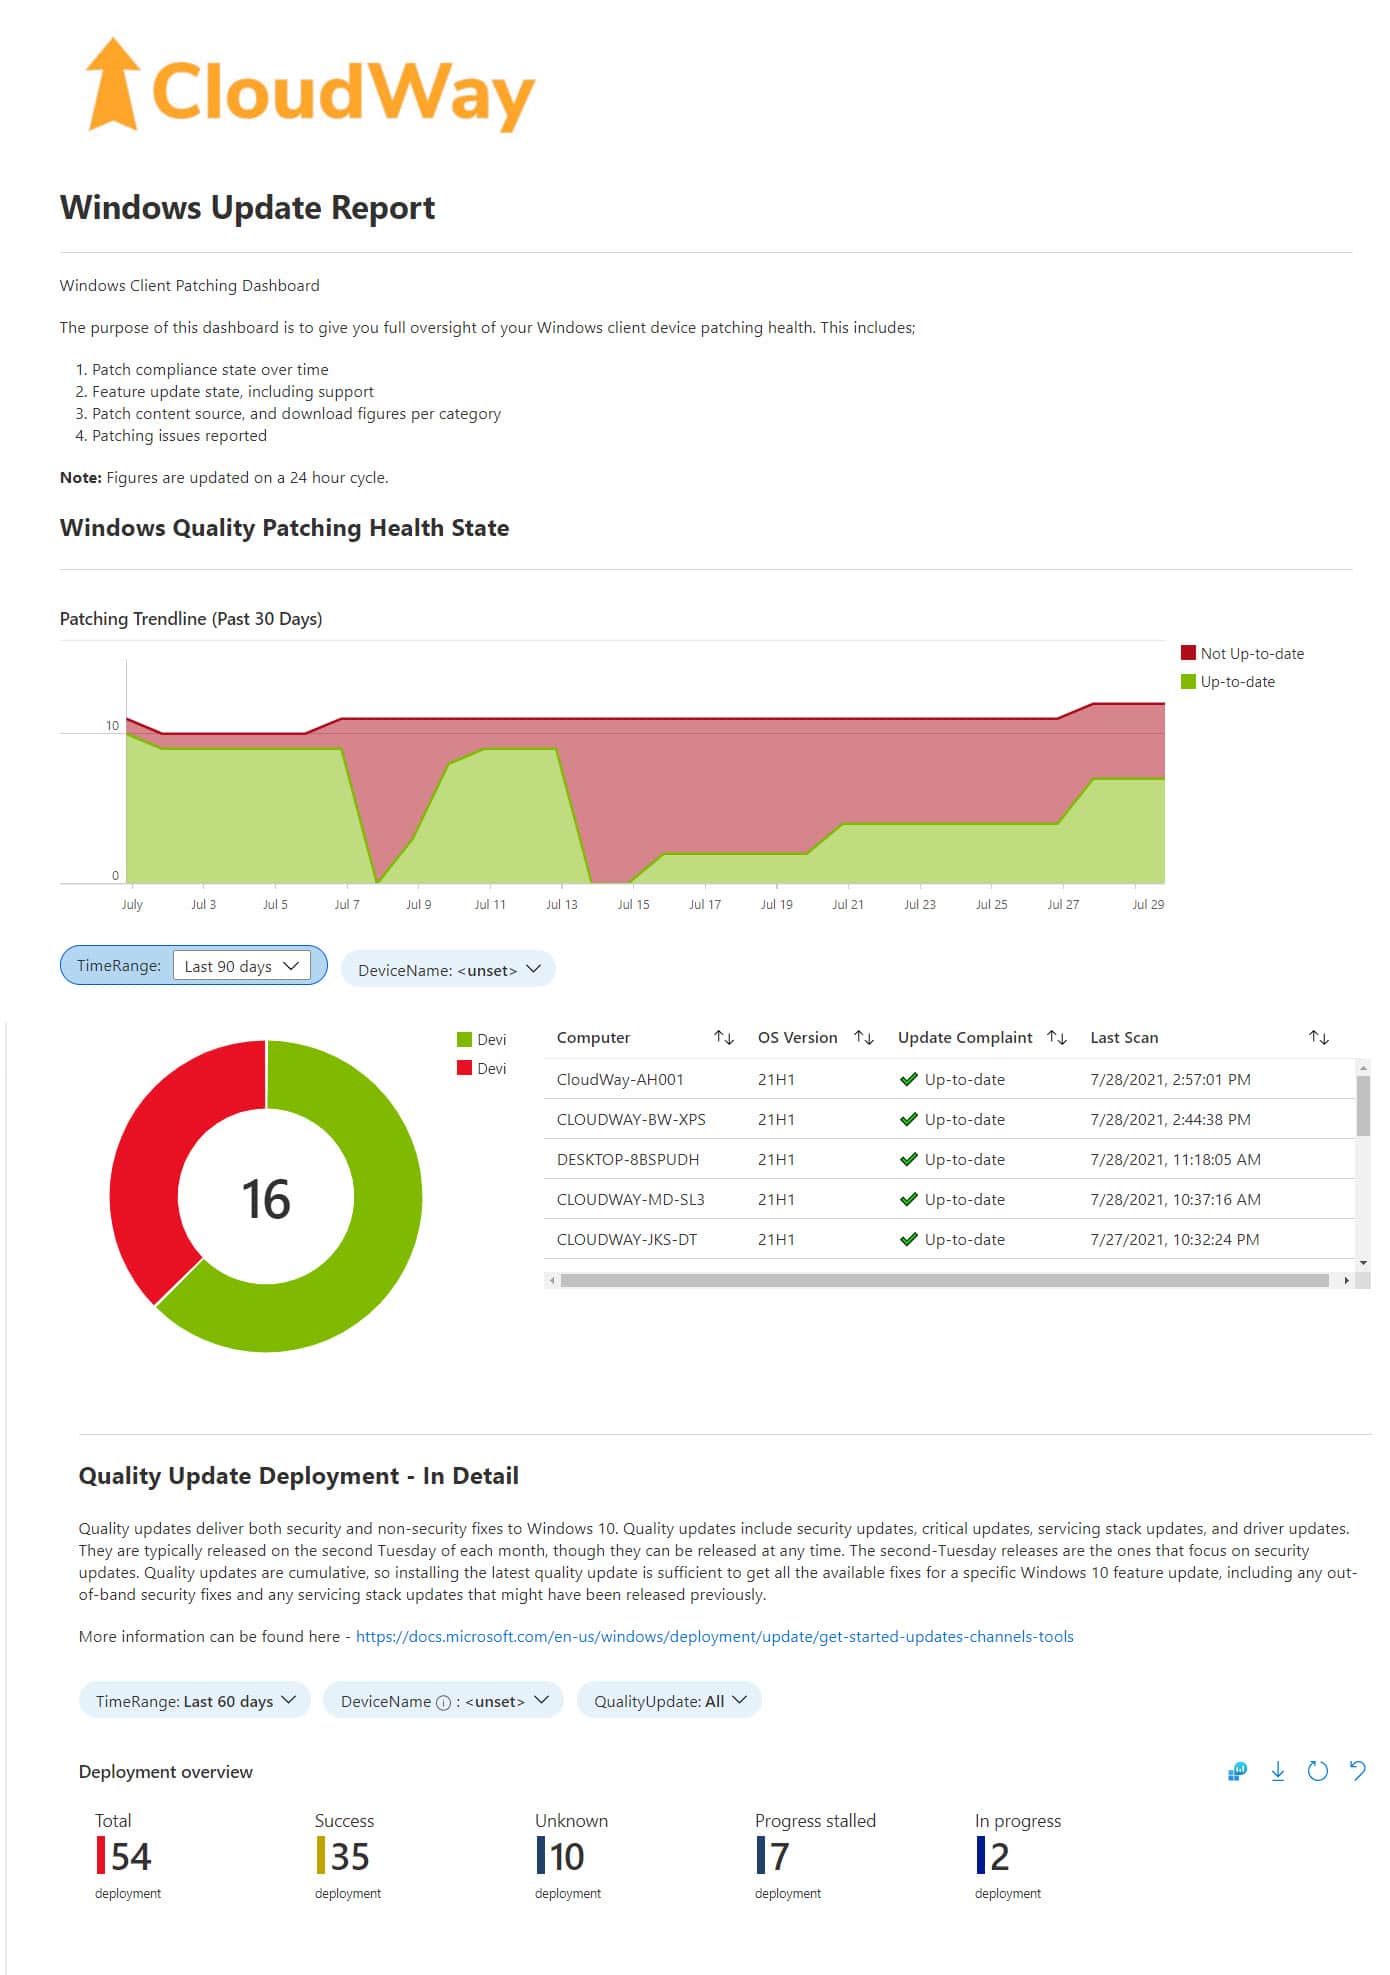
- Patch compliance over time
- Full list of KB’s installed, including success rates, failure rates, etc
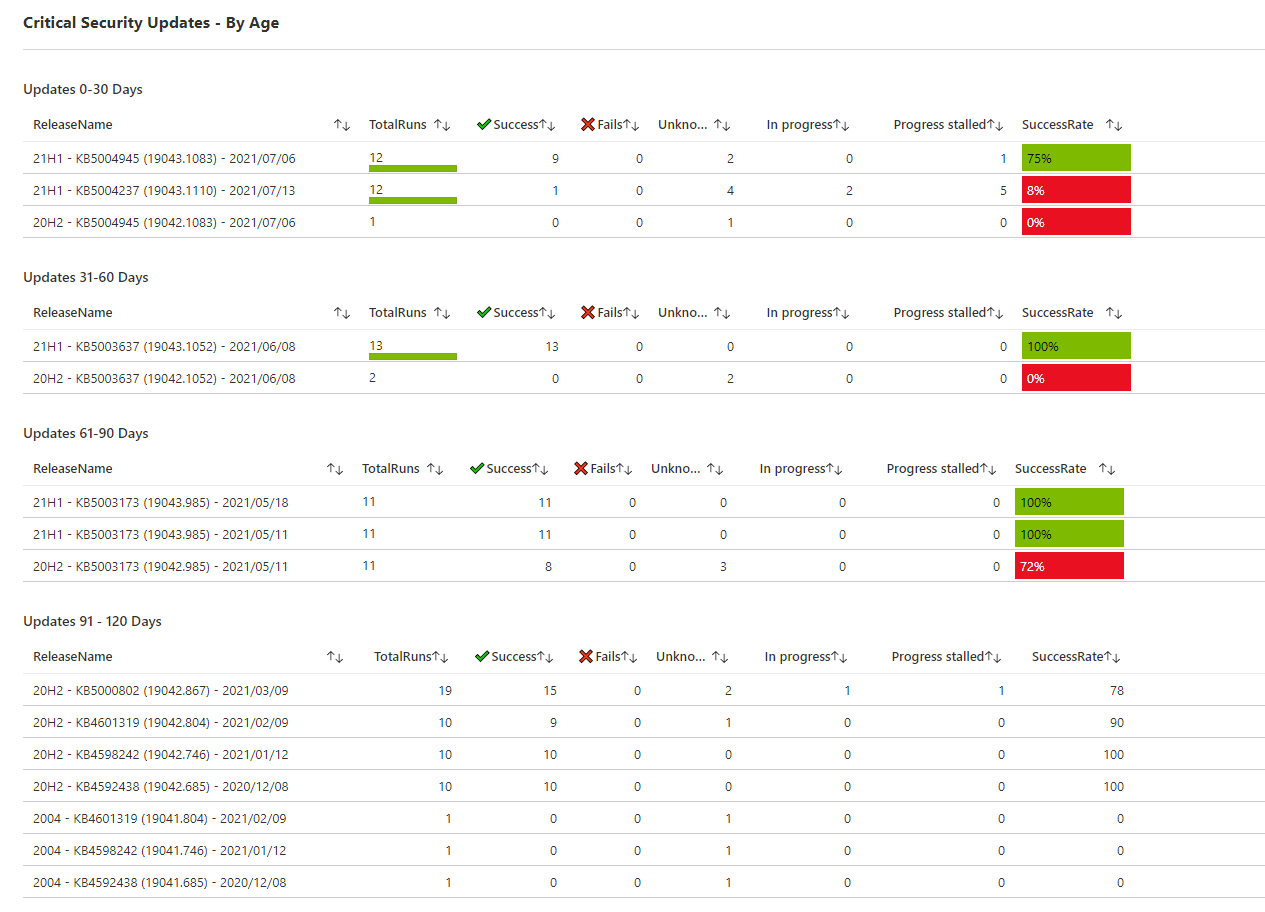
- Patching of KB’s over specific time periods
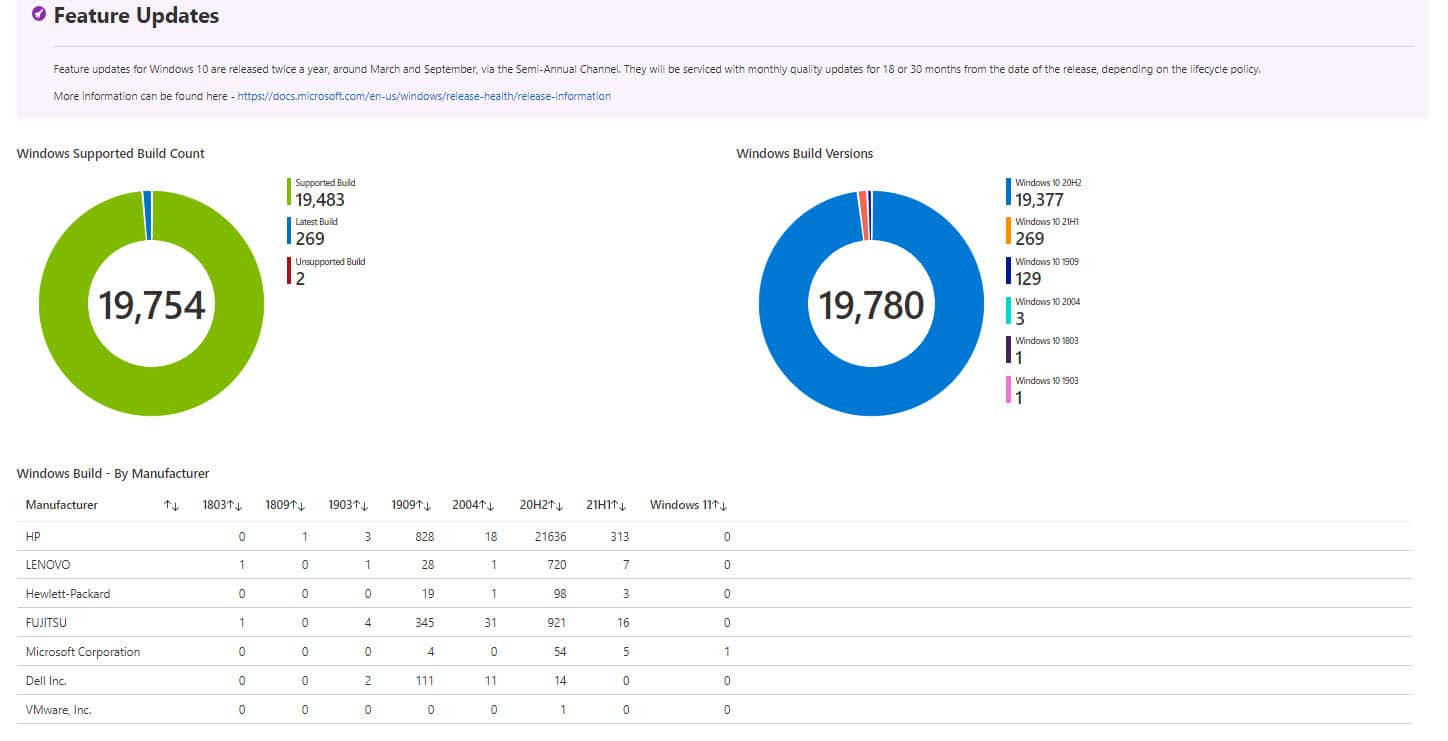
- Feature update trends
- Unsupported builds of Windows 10 in our environment
- Windows 10 builds – per OEM manufacturer
- Update sources
- PrintNightmare Compliance
Does that sound good to you? Let me visualise this for you so you can see what this might look like.
If you want to learn more about the how, keep on reading, but if you are only looking to get this up and running in your environment, go here: Windows Update Compliance Workbook Community Edition
Dashboard Header
Updates by age:
Feature update trending;

Windows Update Sources;

PrintNightmare Patch State;

If this is something that you think would be useful, then read on and I will get you started on the basics of how this information is obtained, and get you on the path to building your own custom dashboards.
Pre-Requisites
Before we set off on this build, let us get the pre-reqs out of the way.
- Azure Subscription Required
- Log Analytics Workspace Required
I’m not going to go through the process of setting up the above, Microsoft have this documented in detail here – Create a Log Analytics workspace in the Azure portal – Azure Monitor | Microsoft Docs.
My recommendation is to have your Intune Diagnostic logs and Azure AD logs also set to send information to the same Log Analytics workspace, so we can easily obtain information from these data sources without having to remember to set different subscriptions in queries.
Update Compliance
As most of you are aware, Microsoft uses telemetry data to help them understand how their products are used. The amount of data being sent can be controlled within the telemetry settings, but in general we are at very least sending information about the Windows build state.
With update compliance we can “tag” data from your organisation so that we can then query the data, which is kind of cool right? The level of detail being sent will impact your ability to report of course, so in examples on this post I am using the “enhanced” setting so that I can see as much as possible.
So let us get started and add Update Compliance from the marketplace to our Azure tenant;
- Log onto the Azure Portal – https://portal.azure.com
- Type in “Update Compliance” in the search bar and you should have a screen similar to the one below;
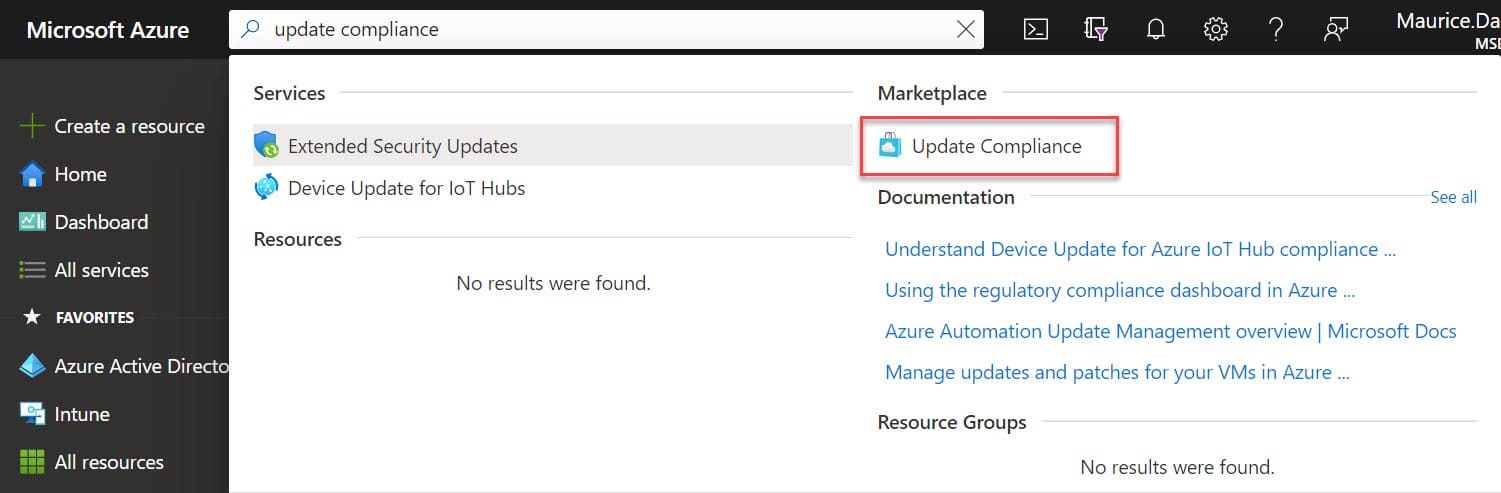
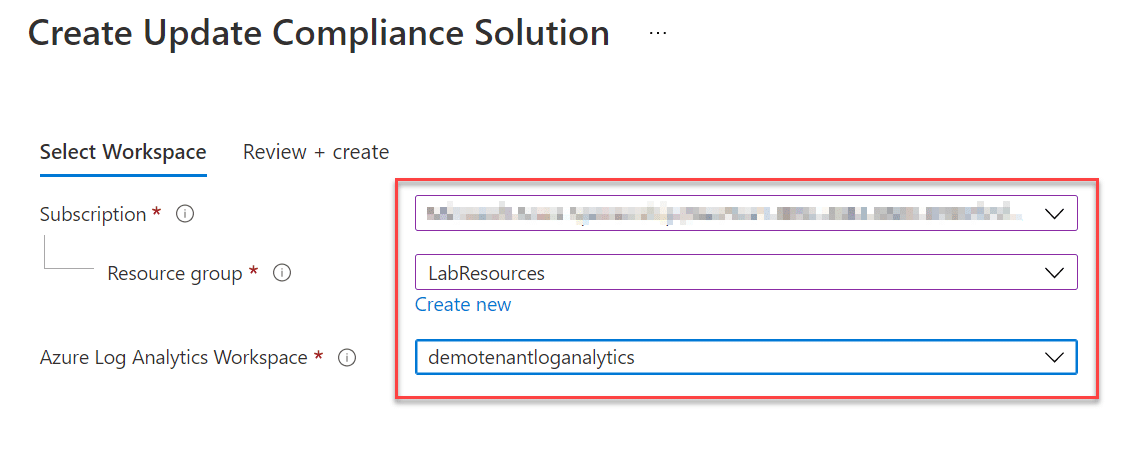
- Click on Update compliance and it will now bring you to the following screen where you can select your Azure subscription, resource group, and log analytics workspace;
- Continuing to the next screen, the validation process first checks everything is in place (permissions, billing etc)
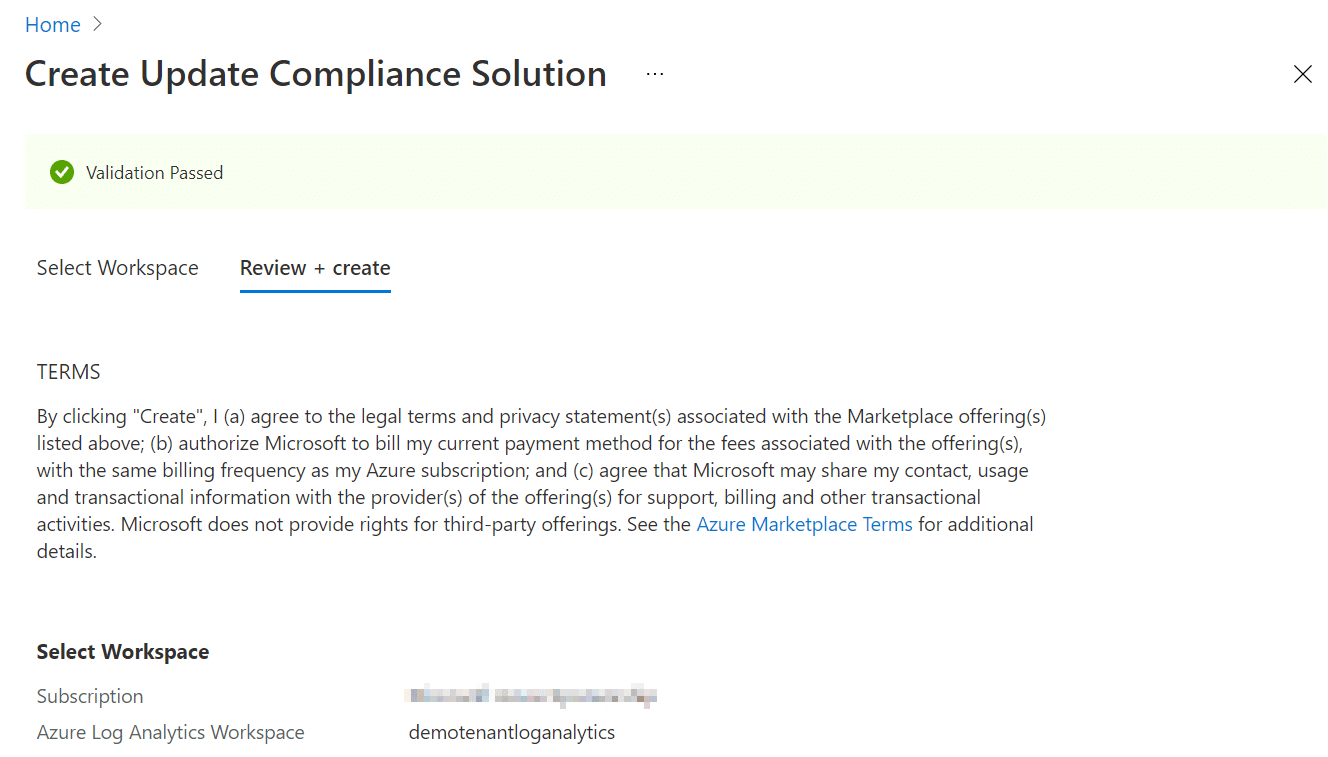
- Clicking on Create we should then have a visual indicator that the resource is being added. This process should only take a short time to complete;

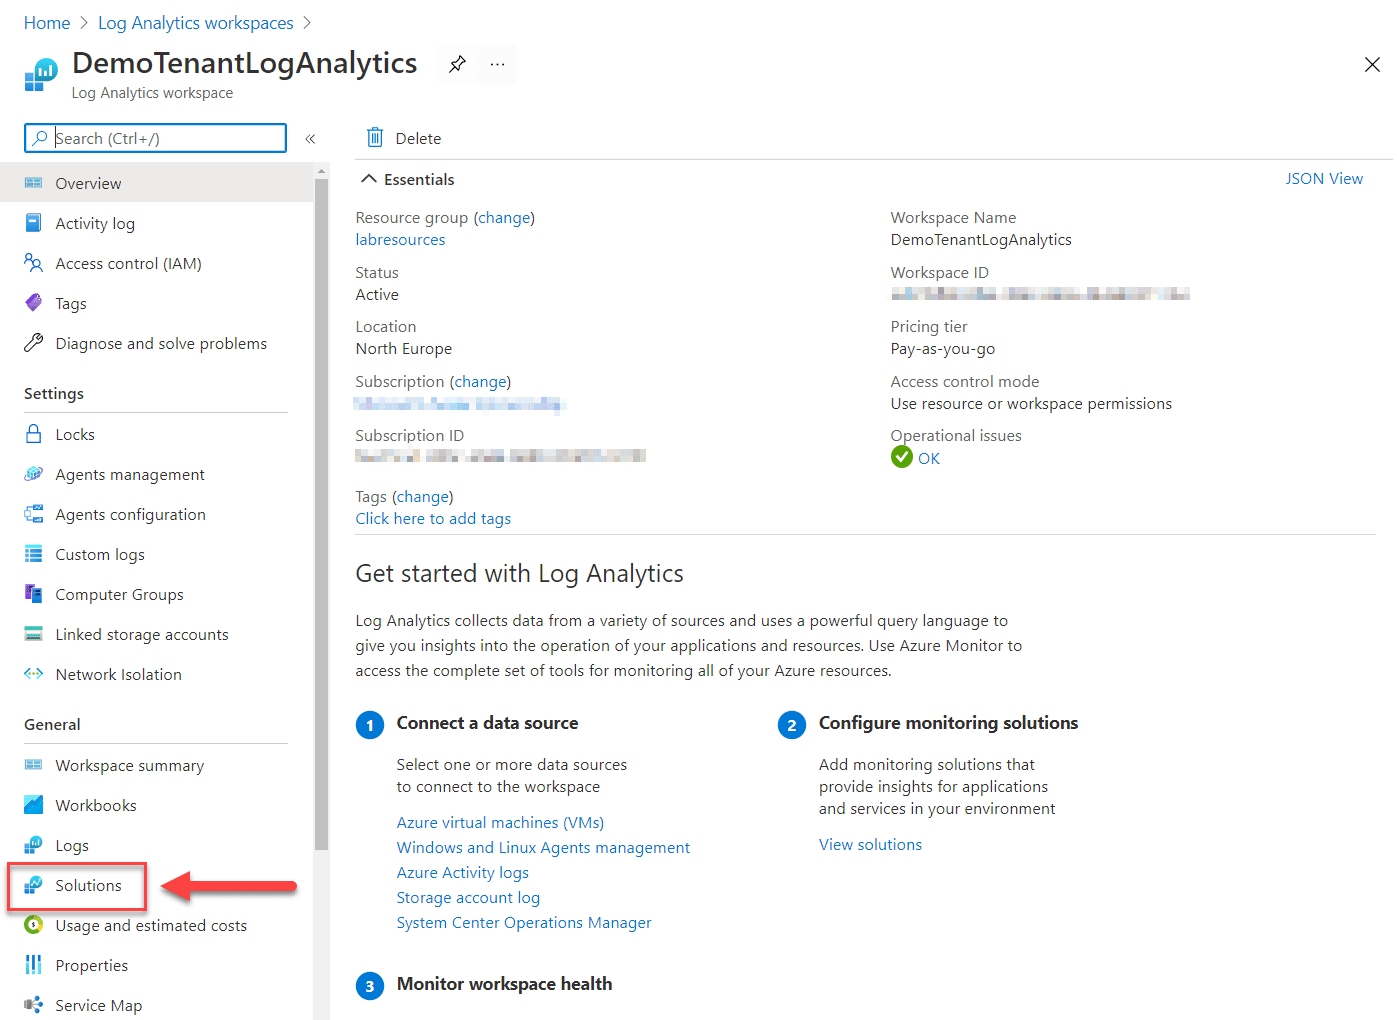
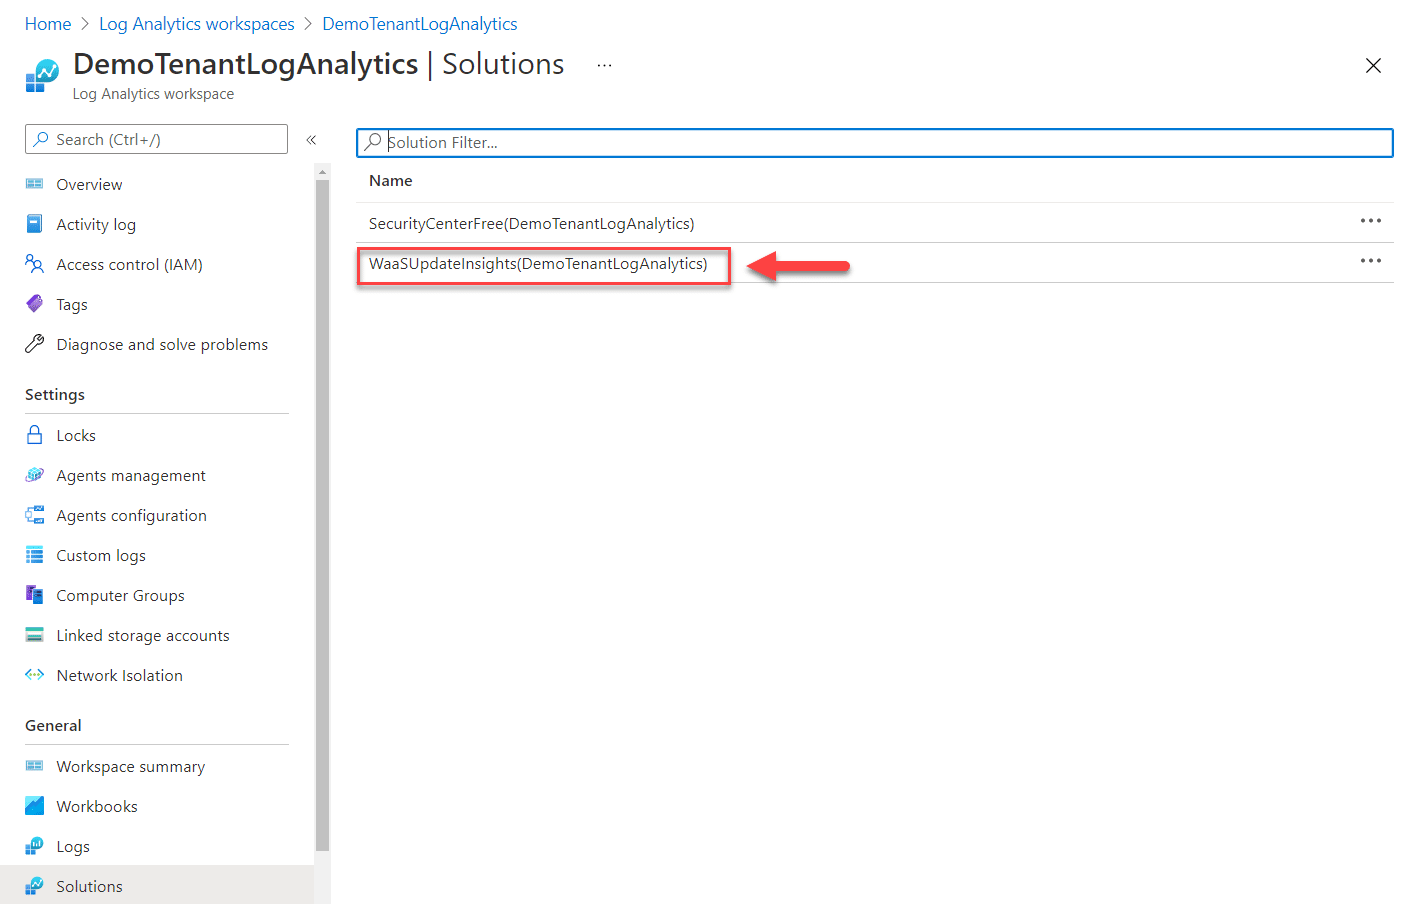
- Once completed, if you go to the Log Analytics workspace you added the solution to, we can obtain the commercial ID that we will then use to “tag” your telemetry data with
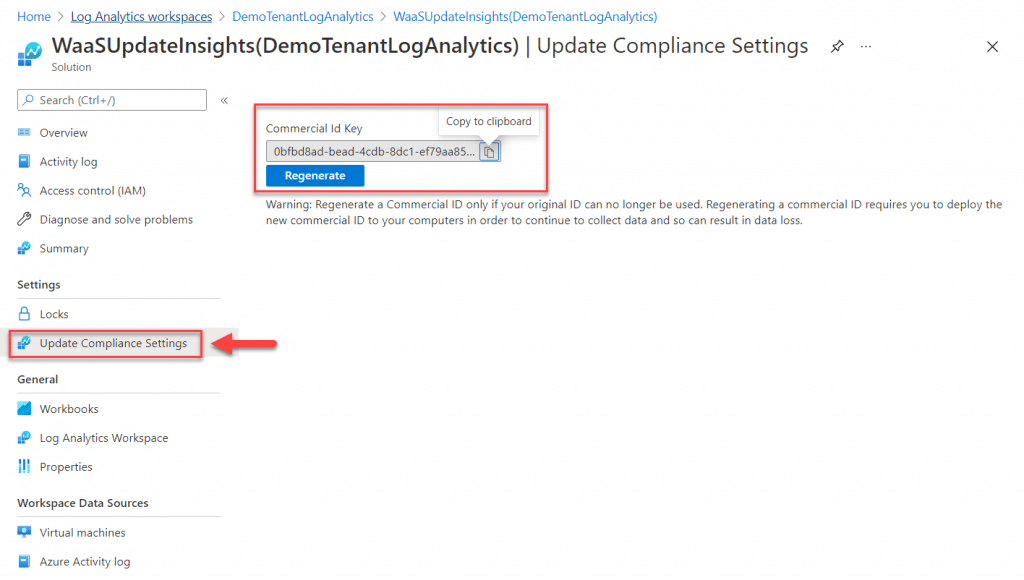
At this point we now have Update Compliance added, the next thing we need to do is to push out configuration to your Windows 10 client machines so they send the required level of telemetry data and associated the data with our commercial ID.
Client Configuration
The settings for update compliance in this example are going to be pushed out via Intune in the form of a Custom (CSP) policy.
- Open the Endpoint Manager Admin Center – https://endpoint.microsoft.com
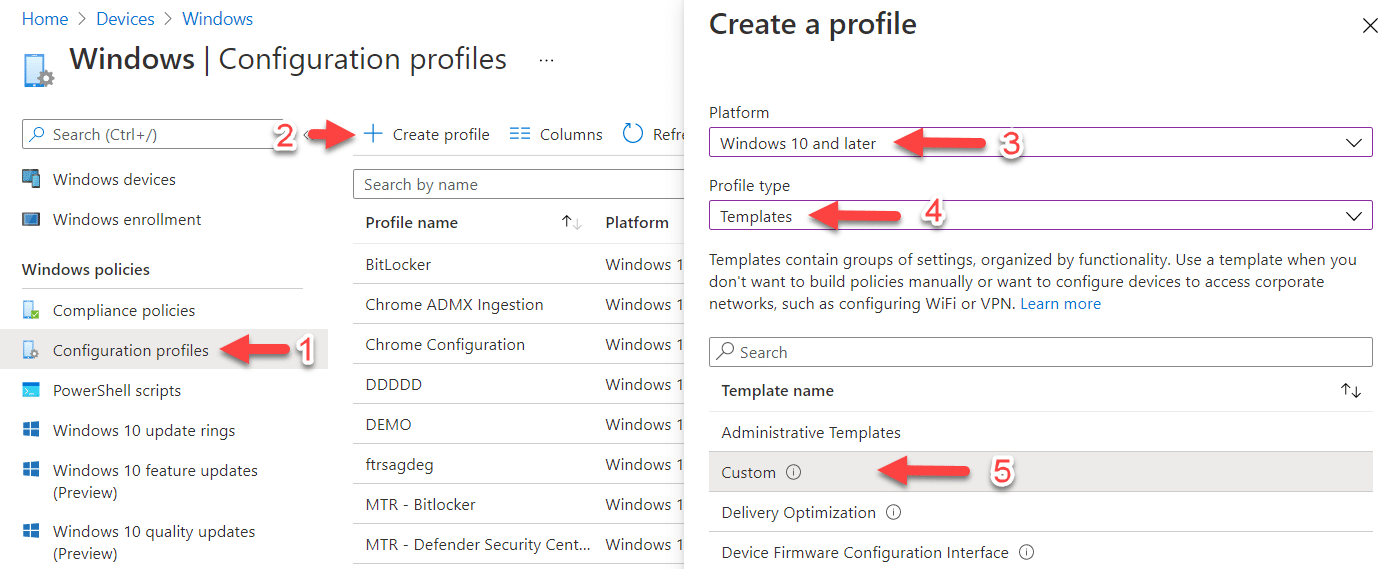
- Click on Devices, Windows, and Configuration Profiles
- Click on “+ Create Profile”, then select Windows 10 as the platform, Templates as the profile type, and Custom as the template name
- Click on “Create”
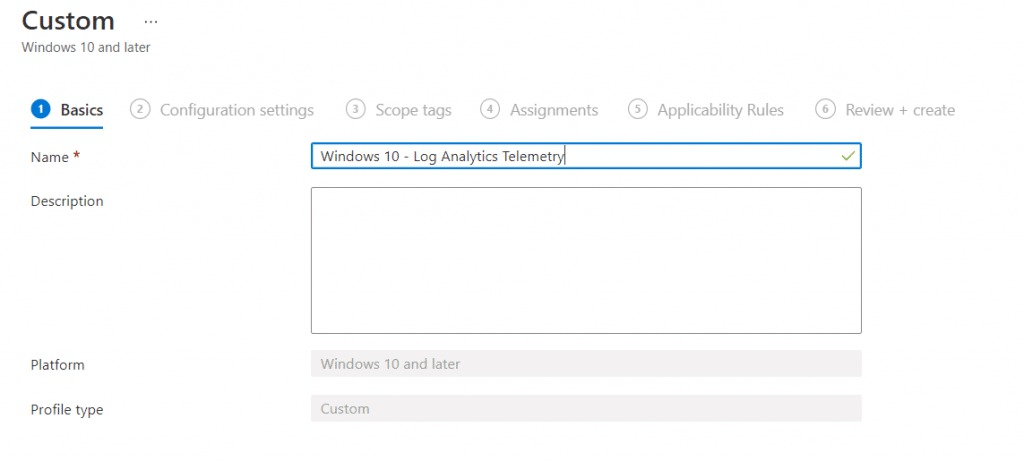
- Give your profile a name
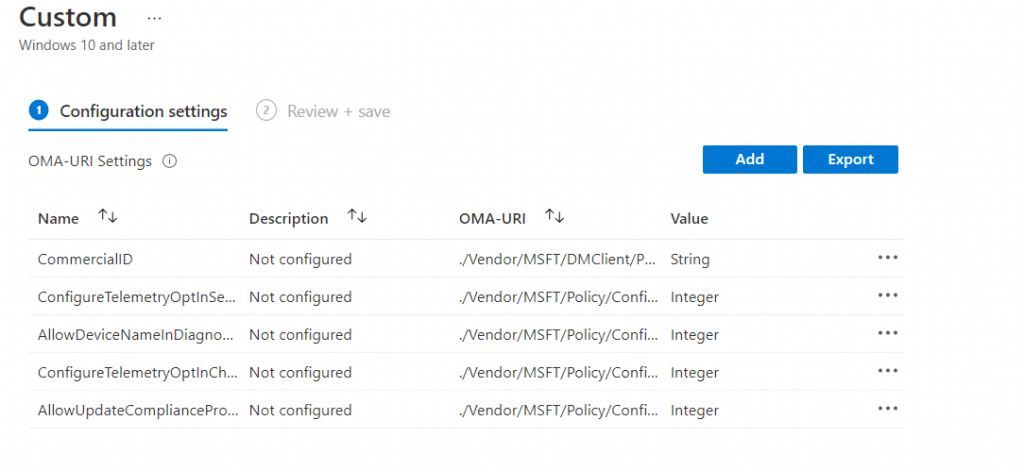
- Now we need to add some OMA-URI values to the policy;
Commercial ID
Name: CommercialID
Description: Commercial ID used for Update Compliance reporting
OMA-URI: ./Vendor/MSFT/DMClient/Provider/MS DM Server/CommercialID
Data Type: String
Value: %YOURCOMMERICALID%
Allow Telemetry
Name: AllowTelemerty
Description: Sets the diagnostic data level
OMA-URI: ./Vendor/MSFT/Policy/Config/System/AllowTelemetry
Data Type: Integer
Value: 3
Telemetry Opt-In Settings
Name: ConfigureTelemetryOptInSettingsUx
Description: Disables telemetry user interface
OMA-URI: ./Vendor/MSFT/Policy/Config/System/ConfigureTelemetryOptInSettingsUx
Data Type: Integer
Value: 1
Device Name Inclusion
Name: AllowDeviceNameInDiagnosticData
Description: Allows the computer device name in the analytics data
OMA-URI: ./Vendor/MSFT/Policy/Config/System/AllowDeviceNameInDiagnosticData
Data Type: Integer
Value: 1
Telemetry Change Notification
Name: ConfigureTelemetryOptInChangeNotification
Description: Disables change notification to telemetry settings from being displayed
OMA-URI: ./Vendor/MSFT/Policy/Config/System/ConfigureTelemetryOptInChangeNotification
Data Type: Integer
Value: 1
Update Compliance Processing
Name: AllowUpdateComplianceProcessing
Description: Allows update compliance processing post May 10, 2021
OMA-URI: ./Vendor/MSFT/Policy/Config/System/AllowUpdateComplianceProcessing
Data Type: Integer
Value: 16
Note: If you have deployed the above settings prior to May 10th of 2021, you will need to ensure this value is included going forward.
- You should now have a policy similar to the one below:
- Click on “Review + save” and assign the policy to a group containing all of your Windows 10 devices
If you are unsure of any element in the above and have security concerns about the level of data, please refer to the Microsoft documentation on configuring machines for Update Compliance here – Configuring Microsoft Endpoint Manager devices for Update Compliance – Windows Deployment | Microsoft Docs and the CSP settings documentation here – Policy CSP – System – Windows Client Management | Microsoft Docs
Hold Up – Update Compliance Data Delay
At this point it is worth noting that there will be a delay of 72 hours for your devices to start reporting data through to your Log Analytics workspace. We can of course configure the workbook, but my suggestion is you wait for this process to kick in first, so you can see data appearing and validate this as you go.
Time To Build A Dashboard
In this section we will run through how to first of all query the data in Log Analytics, then take the values we want and put them into a custom Workbook.
I know a lot of you will be asking me could I just share the Workbook with you, unfortunately though time and effort with customers means this workbook is IP of my employer and can’t be directly shared. I’m not going to give you a hard sell on that, as you know where to find me if you want to go down that road. What I am going to do though is give you some inspiration to get yourself started with this and who knows where this will go for you.
Lets get started then
- The first thing we want to do is check to see if the data is being reported back in correctly (i.e with the computer names etc). So go back to your Log Analytics Workspace and click on “Logs”
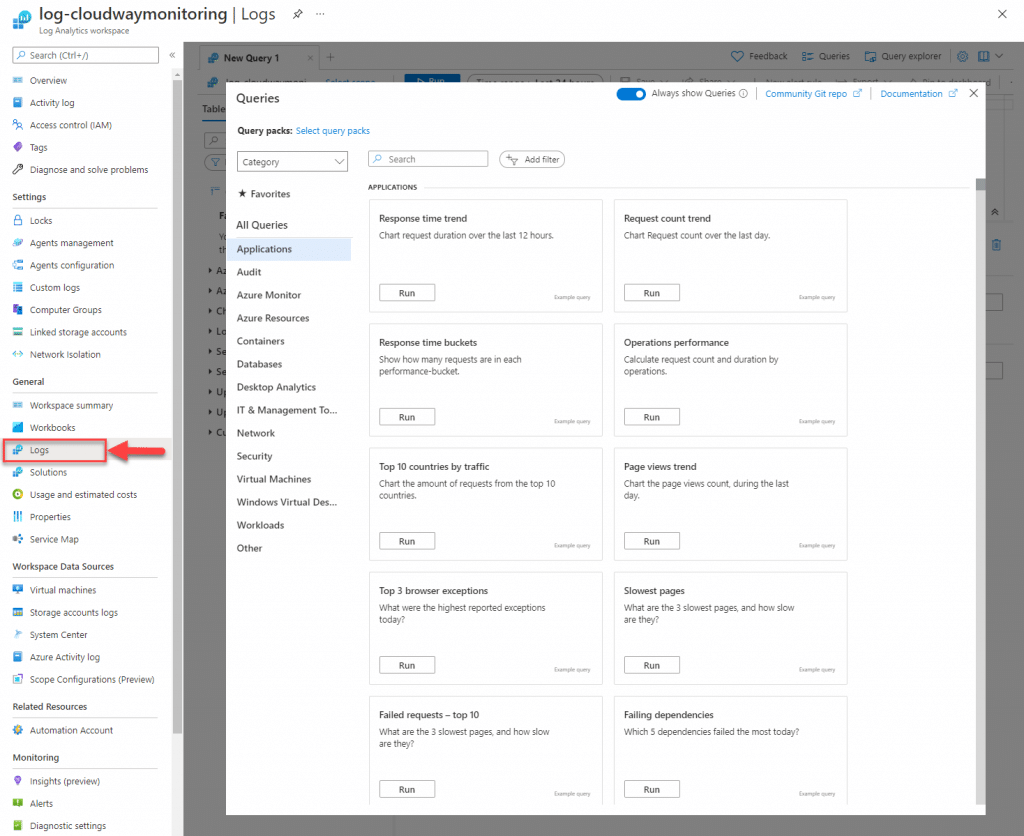
- Clicking out of the Queries prompt, you should now see a list of logs which you can obtain information from;
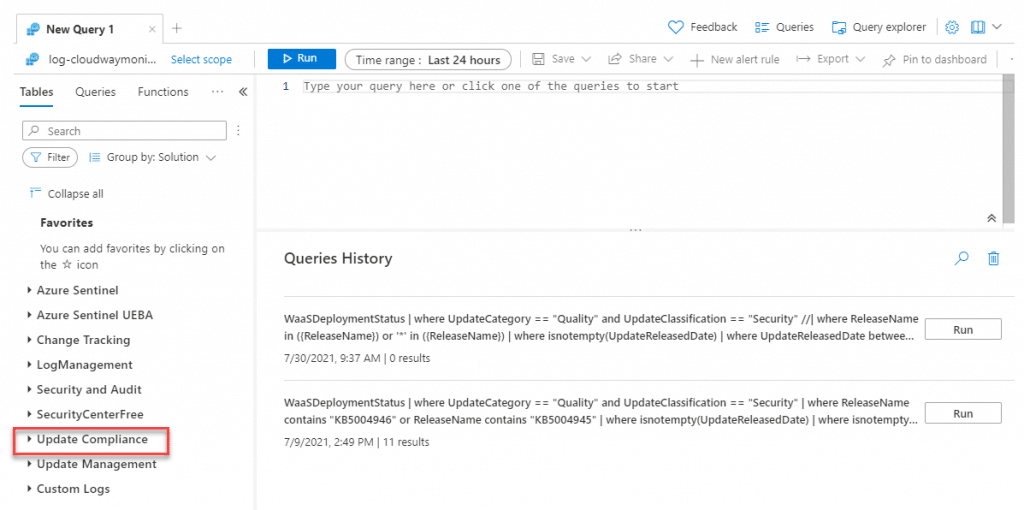
- The log we will be focusing on here, is the “Update Compliance” log
- Clicking on this and expanding it, you should see the following;
WaasDeploymentStatus
WaaSInsiderStatus
WasSUpdateStatus
WUDOAggregatedStatus
WUDOStatus
Details on the above tables can be found here – Update Compliance Data Schema – Windows Deployment | Microsoft Docs
- Querying the WaasDeployment table for instance, we can see the following information;
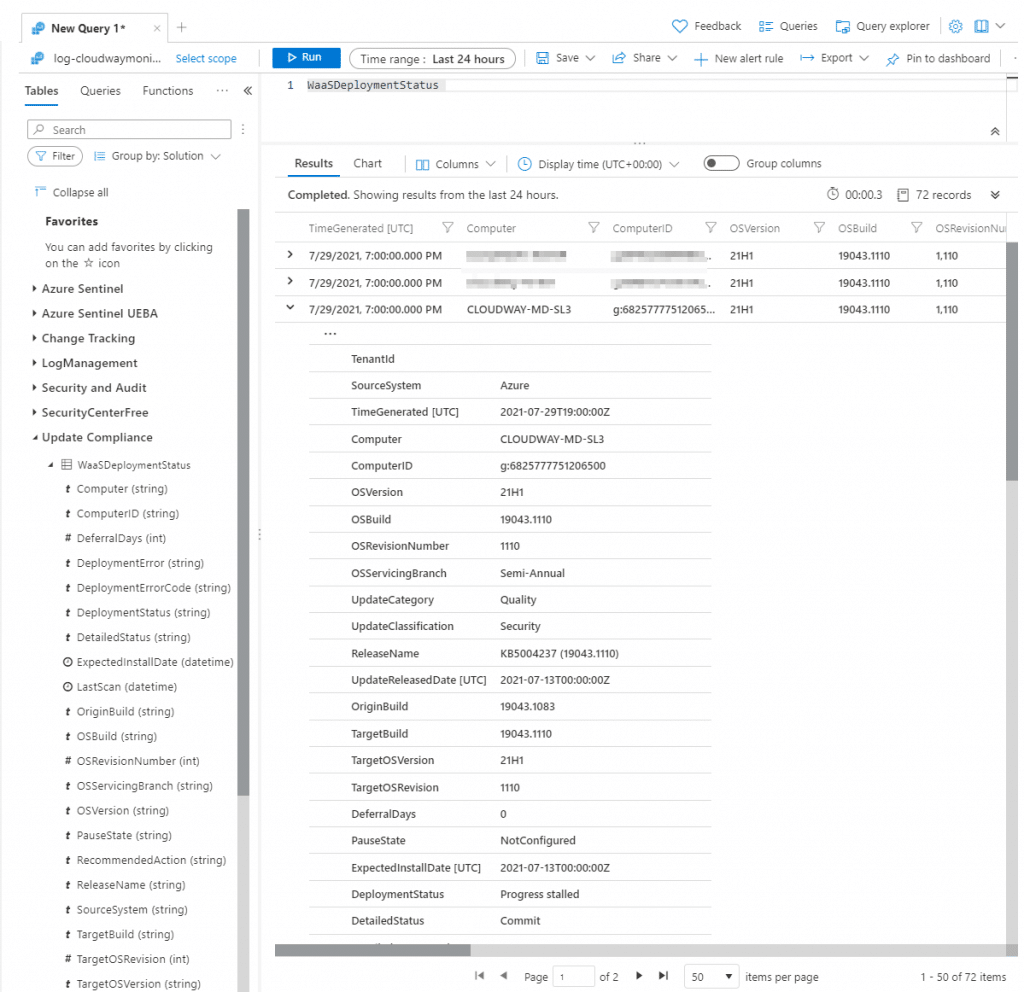
As you can see from the above, we now have detailed information on individual machines, KB’s being installed along with their type, the Windows build number etc. So the idea here is to take those values and summarise them in a method that makes this information easy to consume.
Create A Workbook / Dashboard
- Click on Workbooks and then click on “New”, you should end up with something similar to the below;

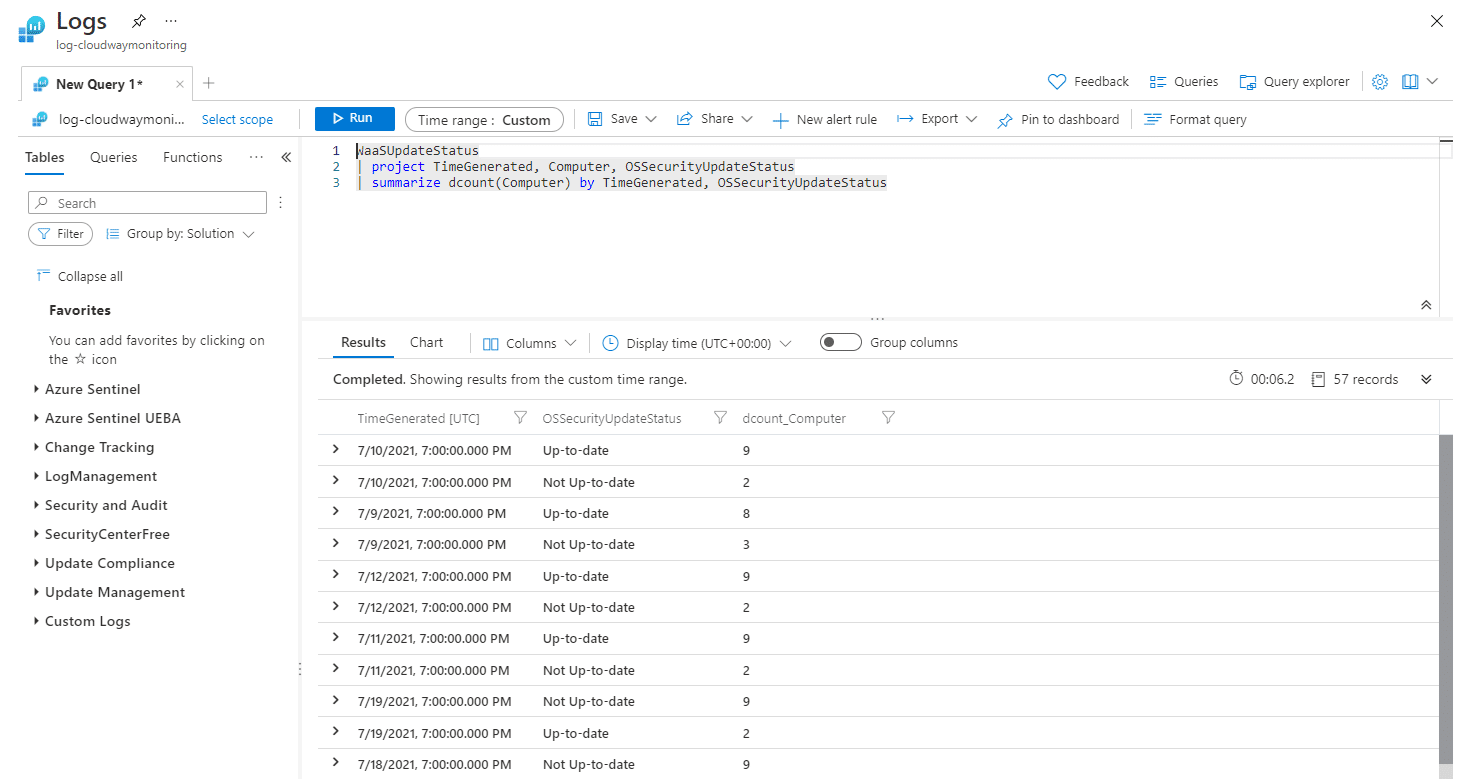
- So let us say you wanted to create a Patch Compliance over the last 30 day trendline, then we could use the WaaSUpdateStatus table to query the OSSecurityUpdateStatus values. As we can see by querying the log using the below query (be sure to set the “Time Range” to a value you require, 30 days for example)
WaaSUpdateStatus
| project TimeGenerated, Computer, OSSecurityUpdateStatus
| summarize dcount(Computer) by TimeGenerated, OSSecurityUpdateStatus
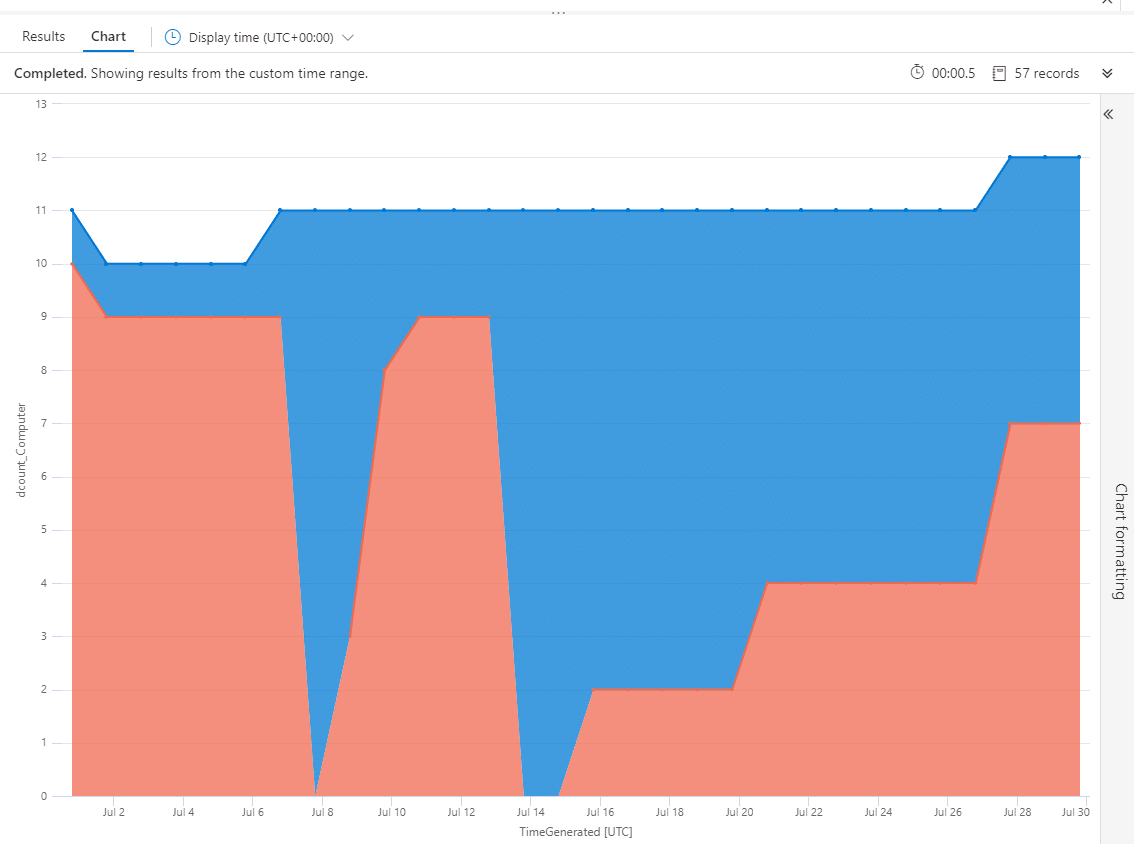
- If we want to visualise the data over time, the area chart or time chart rendering options will display the data within the query going from the oldest to newest date;
WaaSUpdateStatus
| project TimeGenerated, Computer, OSSecurityUpdateStatus
| summarize dcount(Computer) by TimeGenerated, OSSecurityUpdateStatus|
| render areachart
- Taking this back into our Workbook, we can add this visualisation by going to “Add Query”, inputting the query (without the render line) and then select the visualisation that you wish to present, in this example we are using “Area Chart”;
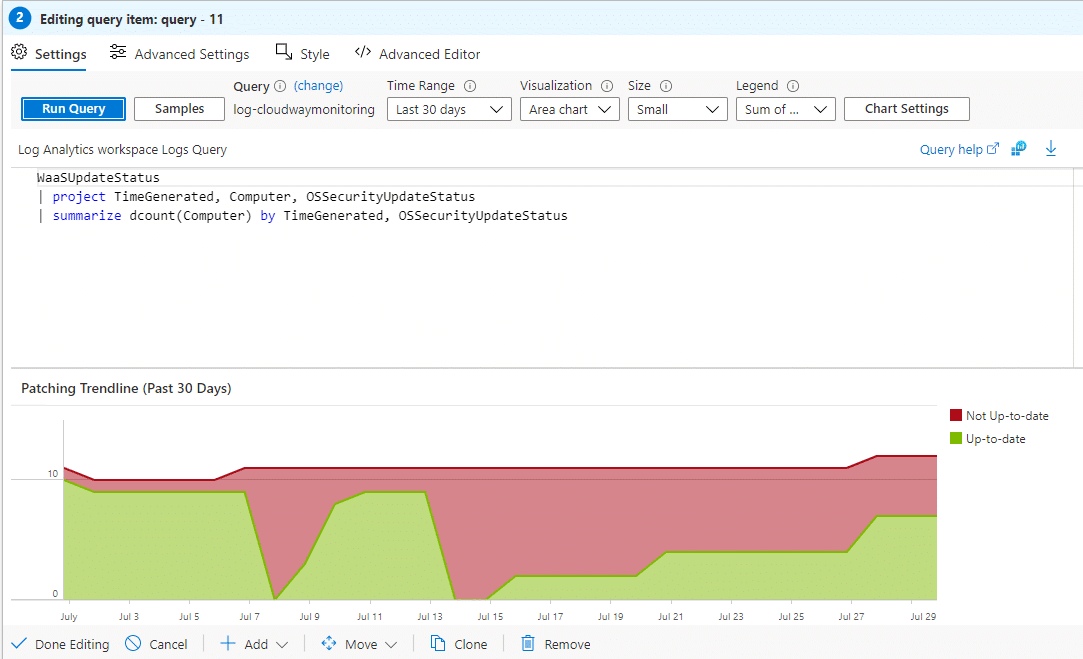
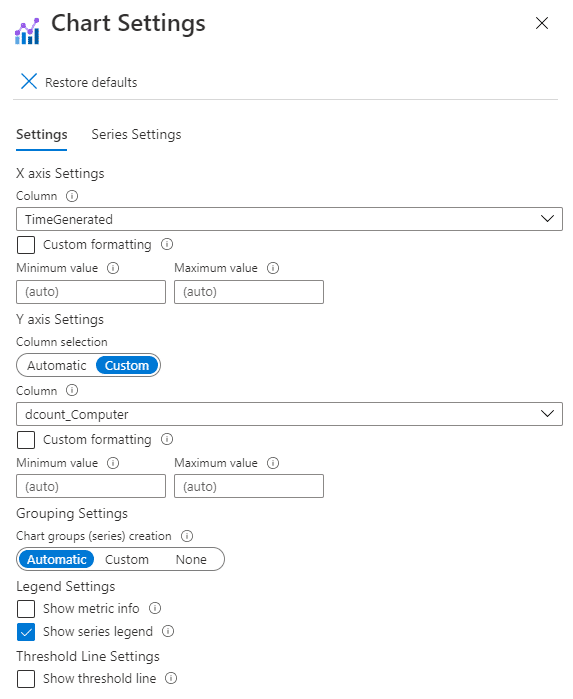
- Now we have some additional controls in here that allow you to “spice up” these visualisations with bar charts, custom colouring etc. Taking an example that we want the “Up-to-date” values displayed as Green, and the “Not Up-to-date” displayed as Red, we simply click on “Chart Settings”
- This now presents us with options for displaying the data;
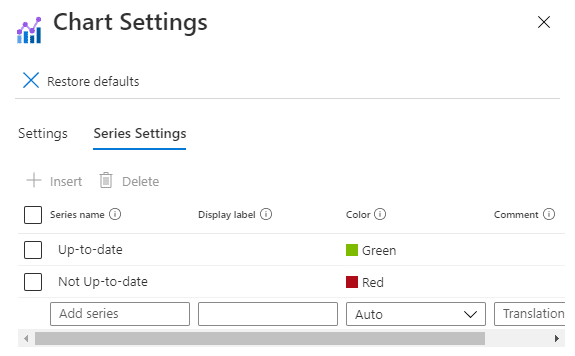
- Clicking on “Series Settings” we can now see the available returned values and do things like change the display name in order to make it easier to read, or change the colour;
So at this point we have done our first simply query to display patching over time. The graph of course will always have a peak and dip as updates are released, but you should be checking for that normal graph to ensure you know clients are being patched.
Give Me More Detail
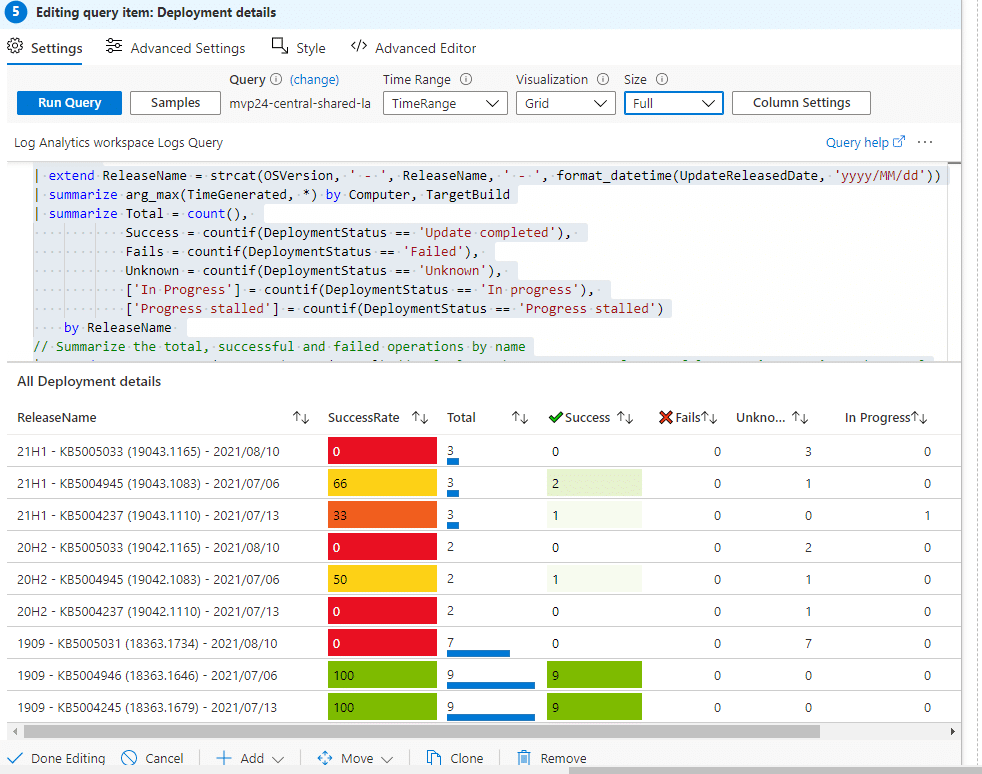
Let us say you wanted to know about patch installation over a specific time period, and report back on the KB, and the success rates for installation then, we could get more complex in our query;
- Bringing this into our workbook, and making some changes to the output and formatting we end up with something like the below;
What About The Donuts?
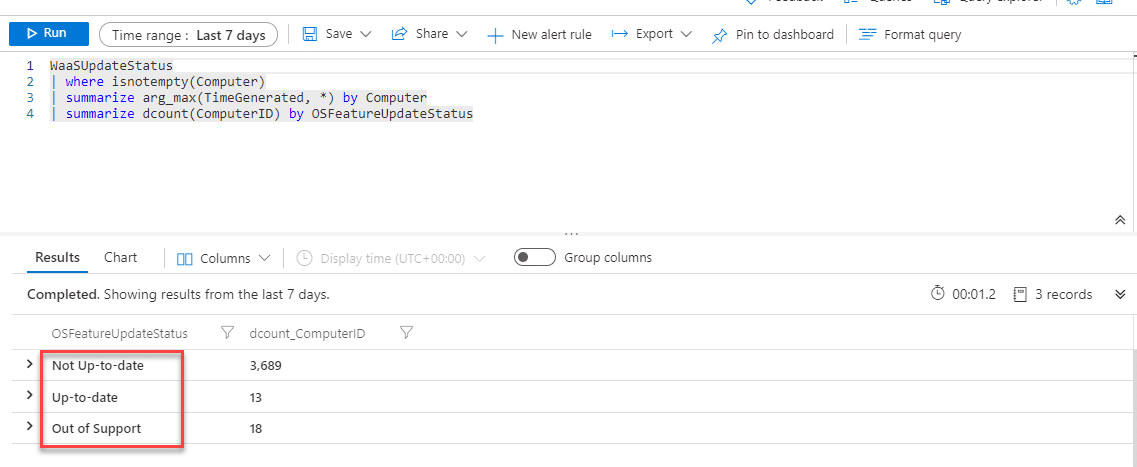
Everyone loves a good donut graph don’t they? Well we can also use that format to visualise something like whether or not we have unsupported builds of Windows in our environment, querying the WaaSUpdateStatus table.
- The query for this one is again simple. As we look at the out put from the query and see the different types of OSFeatureUpdateStatus reported back;
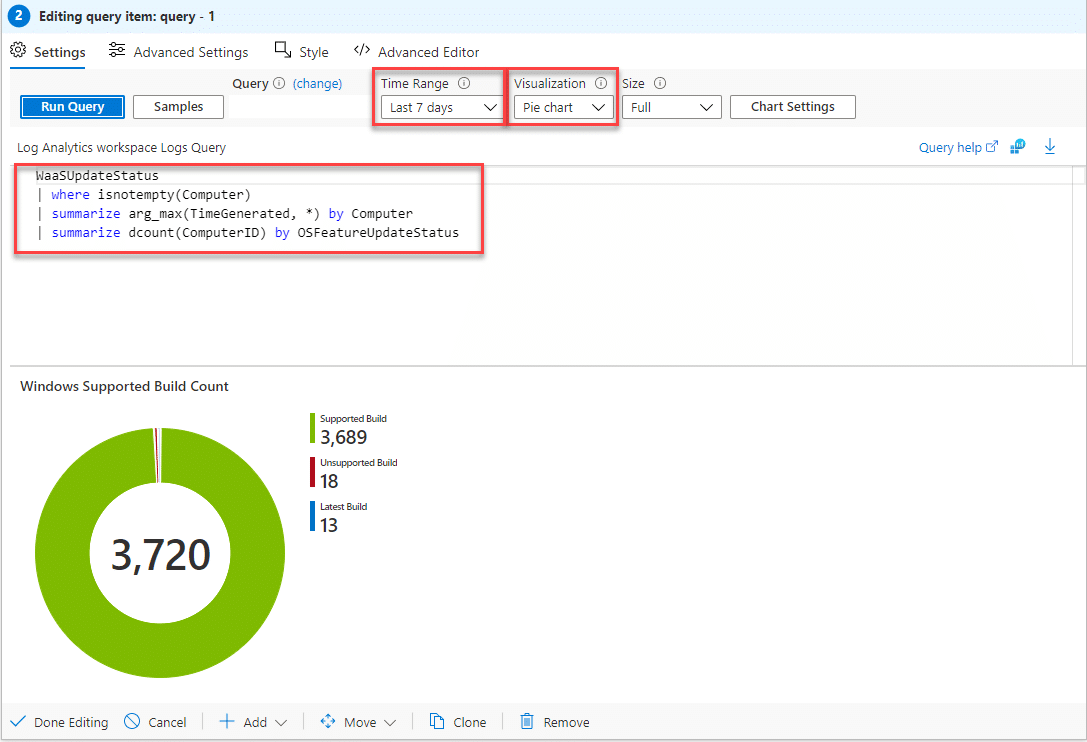
- Now we can use that same query to present a donut report for a defined period;
Some Useful Tips
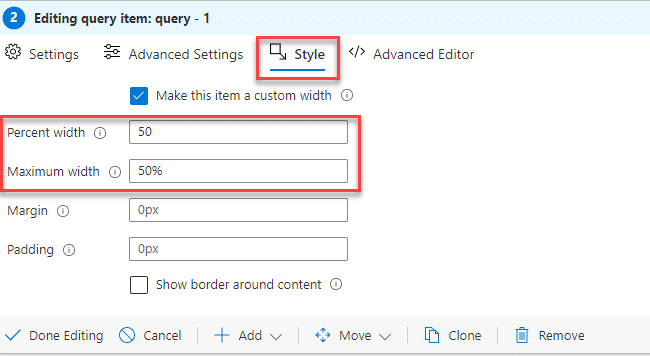
When building your workbook / dashboard, if you want charts to render side by side, you need to specify the max percentage widths of the rendering;
Another tip is to use the “Full” size option, as using even medium or large can result in the graphs having a lot of white space around them.
Finally one last thing. Include links to Microsoft documentation so those reviewing the reports can understand their purpose and severity.
Providing Access To Your Workbook / Dashboard
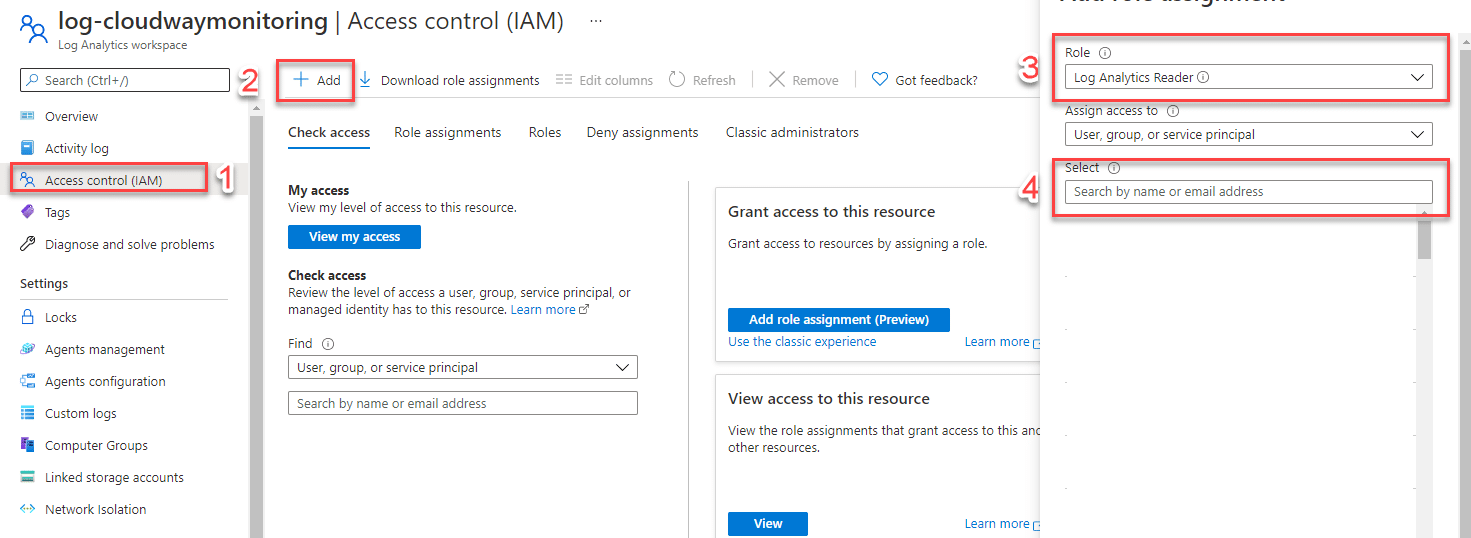
To view workbooks and the data within, users must have at least the Log Analytics Reader role assigned on the Log Analytics Workspace. You can do this by following the below
- Go into the Log Analytics Workspace in the Azure Portal
- Click on Access Control (IAM)
- Click on “+ Add”
- Select the “Log Analytics Reader” role for those who just need to view the data, or “Log Analytics Contributor” role for those who need to add/edit workbooks;
Conclusion
I hope you are now inspired to start playing around with the data you can obtain from Log Analytics / Update Compliance, and start building your own awesome dashboards!. I would like to thank Jan Ketil Skanke @jankeskanke and Sandy Zeng @sandy_tsang for contributing to this post and the dashboard demonstrated here.
Thanks for reading.


Hi Maurice… great article and it really encouraged me to dive into the update compliance logs.
I took the liberty of copying out the ‘Give Me More Detail’ example you provided above, but every time I run it, I get vastly different numbers.
I’m wondering if you could let me know if it’s my transcribing skills or something else.
The query I’m using is:
WaaSDeploymentStatus
| where UpdateCategory == “Quality” and UpdateClassification == “Security”
| where isnotempty (UpdateReleasedDate)
| where UpdateReleasedDate between (ago(120d) .. now())
| where isnotempty (Computer)
| extend ReleaseName = strcat(OSVersion, ‘ – ‘, ReleaseName, ‘ – ‘, format_datetime(UpdateReleasedDate, ‘dd/MM/yyyy’))
| summarize arg_max(UpdateReleasedDate, *) by Computer, ReleaseName
| summarize Total = count(), Success = countif(DeploymentStatus == ‘Update completed’), Fails = countif(DeploymentStatus == ‘Failed’), Unknown = countif(DeploymentStatus == ‘Unknown’), [‘In progress’] = countif(DeploymentStatus == ‘In progress’), [‘Progress stalled’] = countif(DeploymentStatus == ‘Progress stalled’) by ReleaseName // Summarize the total, successful and failed operations by name
| extend SuccessRate = (Success * 100 / Total) // Calculate the percentage of succesful operations against the total
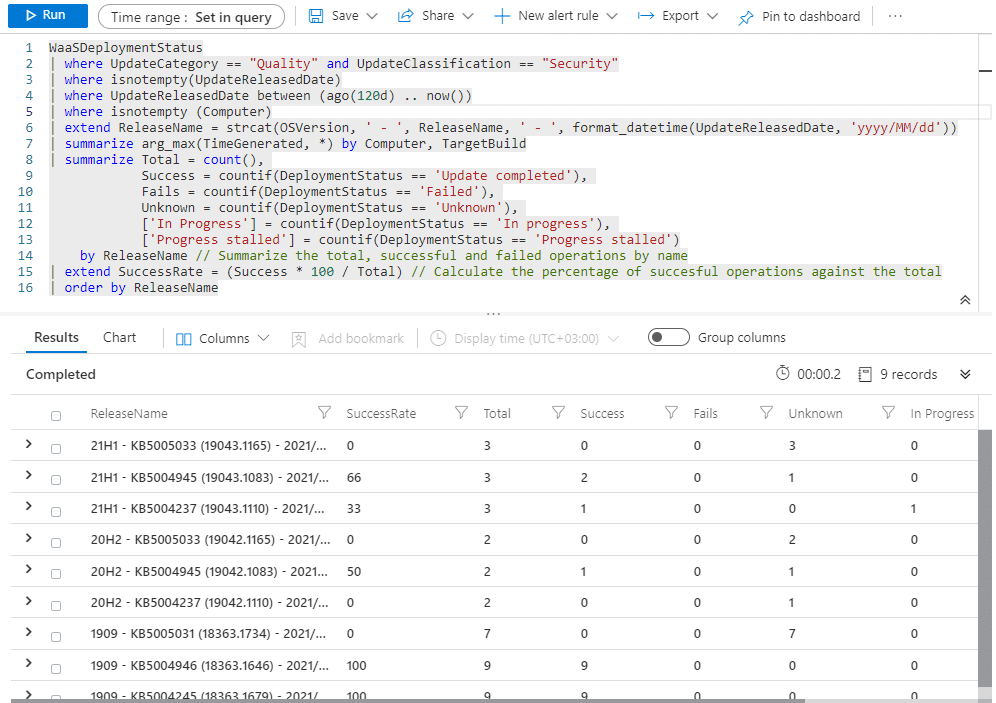
Hello Donal, Thanks for trying out the query. Can you try this one, this should be now stable and I have updated the screenshot in our blog post.
WaaSDeploymentStatus
| where UpdateCategory == “Quality” and UpdateClassification == “Security”
| where isnotempty(UpdateReleasedDate)
| where UpdateReleasedDate between (ago(120d) .. now())
| where isnotempty (Computer)
| extend ReleaseName = strcat(OSVersion, ‘ – ‘, ReleaseName, ‘ – ‘, format_datetime(UpdateReleasedDate, ‘yyyy/MM/dd’))
| summarize arg_max(TimeGenerated, *) by Computer, TargetBuild
| summarize Total = count(),
Success = countif(DeploymentStatus == ‘Update completed’),
Fails = countif(DeploymentStatus == ‘Failed’),
Unknown = countif(DeploymentStatus == ‘Unknown’),
[‘In Progress’] = countif(DeploymentStatus == ‘In progress’),
[‘Progress stalled’] = countif(DeploymentStatus == ‘Progress stalled’)
by ReleaseName // Summarize the total, successful and failed operations by name
| extend SuccessRate = (Success * 100 / Total) // Calculate the percentage of succesful operations against the total
| order by ReleaseName
Worked a treat. Thank you so much for taking the time to look at this.