


With more and more organisations making the move to obtain applications and Windows updates through Intune and Windows Update for Business (WUfB), one thing that often goes overlooked is how to optimise data throughput for this downloaded content. Even for those that have configured policies to set delivery optimization policies, monitoring of this can also be overlooked.
In this post we will look at Delivery Optimization in depth, combined with leveraging Update Compliance logs to monitor and ensure that our delivery optimization configuration is working / optimal based on our network topology.
Distributed Content
Historically a lot of the same organisations have used Configuration Manager, leveraging the distribution points, and local caching options such as branch and peer cache. The benefit of these distribution methods is of course that the load is spread across a range of sources, so there is no single point of bandwidth issues, and content is shared more rapidly.
When we move into the area of Intune and Windows Update for Business, we need to rethink how our client caching works. Microsoft Delivery Optimization Services is a cloud-based solution for peer discovery, whereby individual devices are tracked based on grouping configuration that we define within the MDM (or GPO) policies pushed to the devices.
Let us step through the process undertaken by the client;
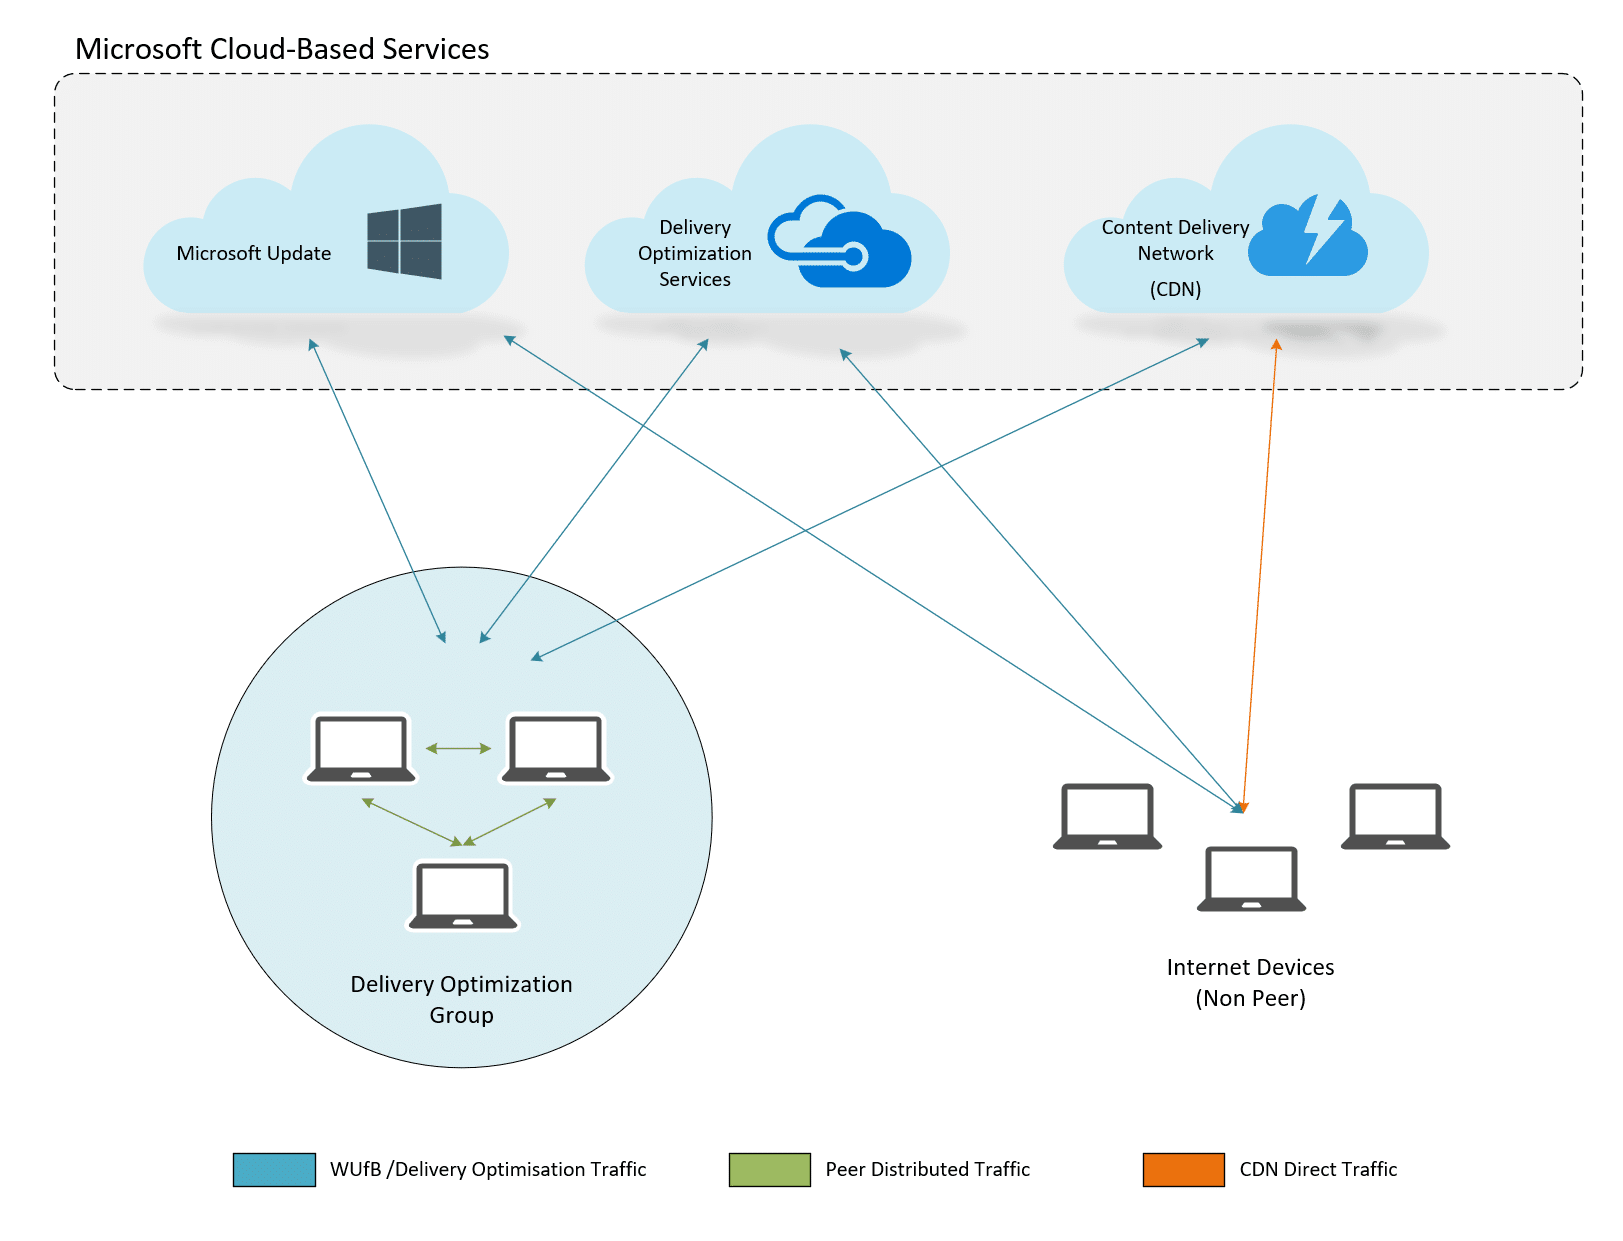
- When a client requests content, the first thing it obtains is metadata about the content it is downloading (contained within a SHA-256 block)
- The authenticity of the metadata is verified to ensure it is obtained from the correct sources (i.e Microsoft trusted sources)
- The client device will now attempt to pull content based on the policy defined, if local peer groups are defined it will pull from these, falling back in any circumstance to the Content Delivery Network (internet based source)
- During the download of blocks of the downloaded content, the hash is verified from the known content metadata already obtained
- Should a peer provide content which has a different hash (older content for example, where an application has been updated), or verification fail in its entirety, the client will fall back to the CDN (simple mode). If a peer source also continuously provides corrupt / invalid content, the source peer will be banned as a source for DO traffic
- Upon download of all content blocks, the entire file is reconstructed and the file signature is verified
So now we understand the technicalities behind how the clients get and share their content, we need to understand the requirements from both a policy and connectivity perspective.
Client Firewall Ports & Internet Sources
For DO to function at all, we need to ensure that the clients can both communicate out to external URL’s, and to other peer sources. This again can be an area which can cause you particular pain, especially if you are in a silo where elements of this are outside of your control. Therefore it is vital that you understand the requirements, so you can educate those making the changes to ensure client peer connections can take place.
External URL’s
Clients must be allowed to communicate to the following URL’s without user authentication, and therefore if you are using proxied internet connectivity based on URL whitelisting, it is vital that you have these URL’s in your PAC configuration to “go direct”.
For Delivery Optimization metadata:
- *.dl.delivery.mp.microsoft.com
- *.emdl.ws.microsoft.com
For the payloads (optional):
- *.download.windowsupdate.com
- *.windowsupdate.com
Windows Update and Microsoft Store backend services and Windows Update and Microsoft Store payloads
- http://.windowsupdate.com
- https://.delivery.mp.microsoft.com
- https://*.update.microsoft.com
- https://tsfe.trafficshaping.dsp.mp.microsoft.com
More information on the URL’s and associated ports can be found here – Delivery Optimization client-service communication explained – Windows Deployment | Microsoft Docs
Delivery Optimization Configuration
For devices to leverage DO groups, connected cache, and peers, you must create a Delivery Optimization policy. Below is an example of how to configure these settings, based on the use of the Settings Catalog policy type using Microsoft Intune.
| Setting | Value |
|---|---|
| DO Absolute Max Cache Size | 20 |
| DO Allow VPN Peer Caching | Block |
| DO Delay Background Download From Http | 600 |
| DO Delay Cache Server Fallback Background | 600 |
| DO Delay Cache Server Fallback Foreground | 60 |
| DO Delay Foreground Download From Http | 60 |
| DO Download Mode | HTTP blended with peering behind the same NAT. |
| DO Group Id Source | AAD (note this is for Intune AADJ in this example) |
| DO Max Cache Age | 0 |
| DO Max Cache Size | 20 |
| DO Min Background Qos | 64 |
| DO Min Battery Percentage Allowed To Upload | 40 |
| DO Min Disk Size Allowed To Peer | 32 |
| DO Min File Size To Cache | 1 |
| DO Min RAM Allowed To Peer | 4 |
| DO Modify Cache Drive | %SystemDrive% |
| DO Monthly Upload Data Cap | 0 |
| DO Restrict Peer Selection By | Subnet mask |
Client Firewall Ports
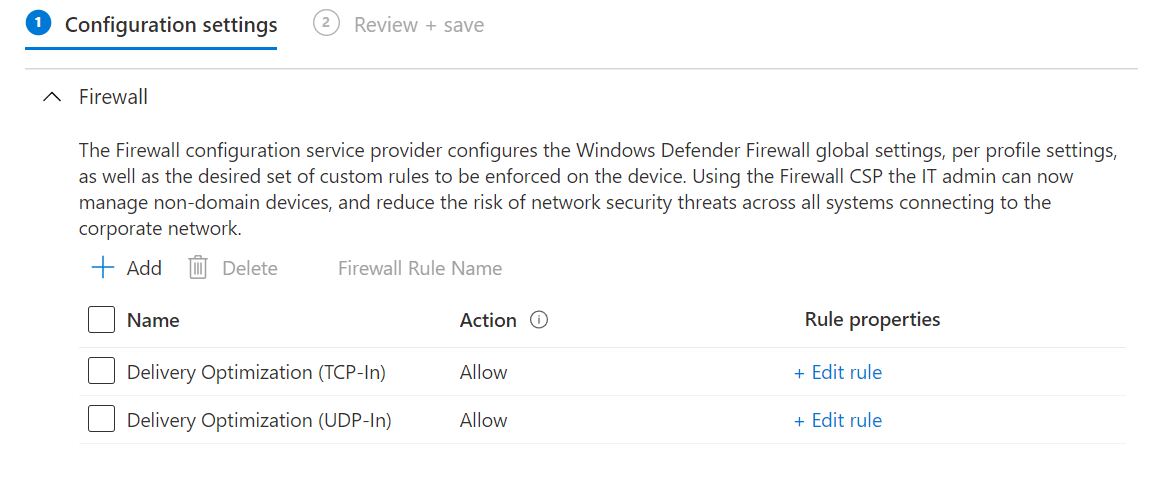
By default, the Windows Defender Firewall will have two rules configured for inbound DO traffic, being both over TCP and UDP on port 7680, as we can see in the below example;

If you are opting to use client peers on the internet (not to be confused with the CDN source), note that traffic is handled via the Teredo protocol on port 3544. More information can be found here – Required Firewall Exceptions for Teredo – Win32 apps | Microsoft Docs
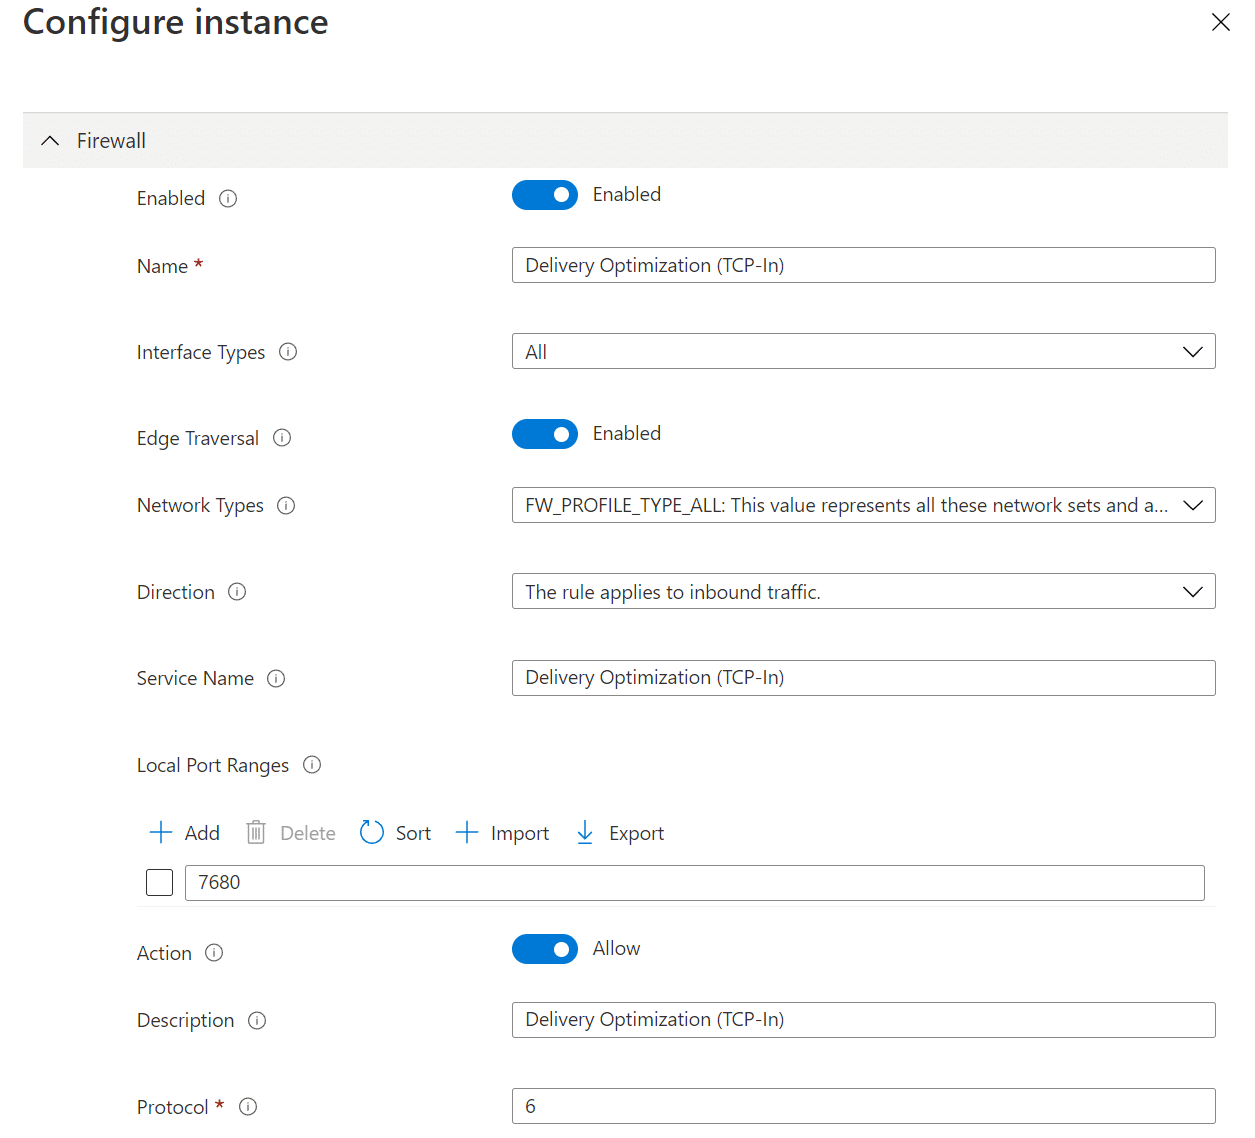
Using the Endpoint Security blade we can configure the required ports and push these out to our client;
PLEASE NOTE
If you are using a third party AV solution, or restricting these rules based on local IP subnetting, it is vital that you get this element configured correctly. Failure to do so will result in all traffic going out to the CDN, and if you have switched over thousands of clients, all routing traffic out through a single internet breakout point, this could invoke the dreaded call from the network admin.
Monitoring Delivery Optimization Success
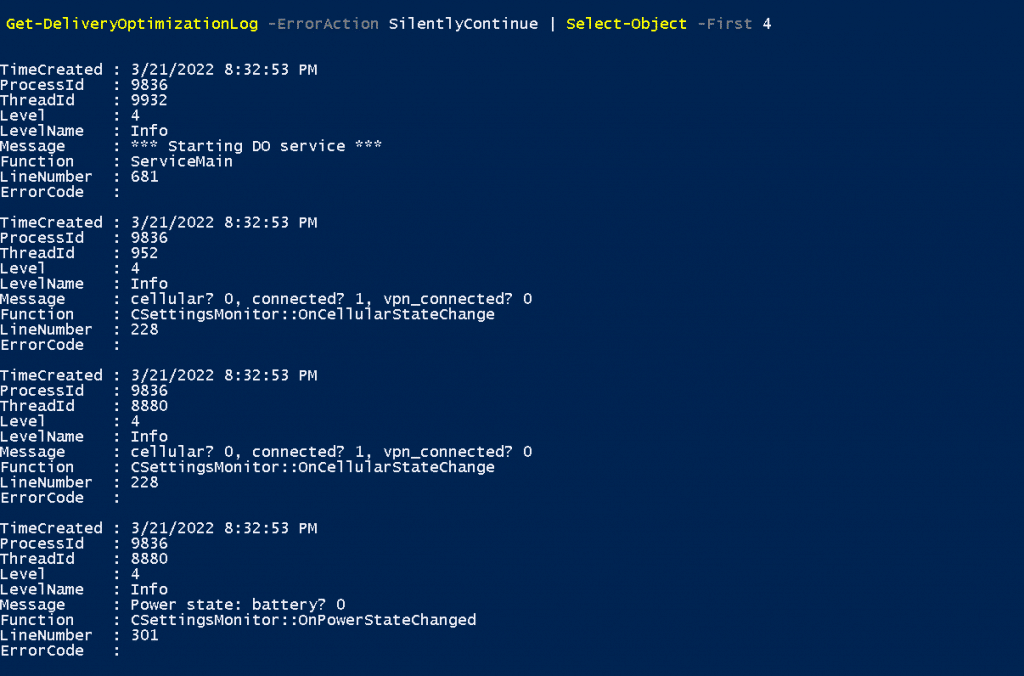
Deploying a policy is the easy part, but it vital that we monitor the success of the configuration in order to ensure DO is being used effectively. Using PowerShell we can achieve this locally on the clients, using the following cmdlets;
- Get-DeliveryOptimizationLog
Reads all logs from the DoSVC logs directory (requires administrative privileges)
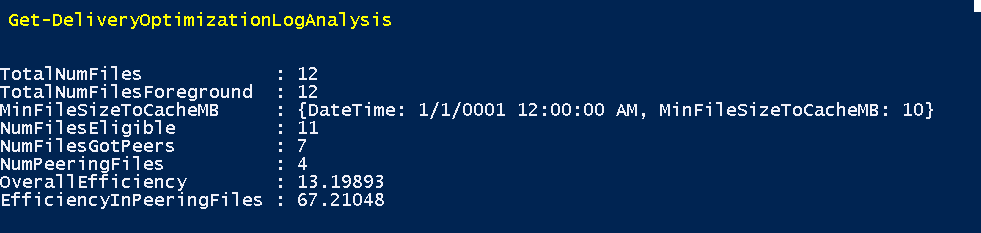
- Get-DeliveryOptimizationLogAnalysis
Provides a summary of the downloaded content and sources
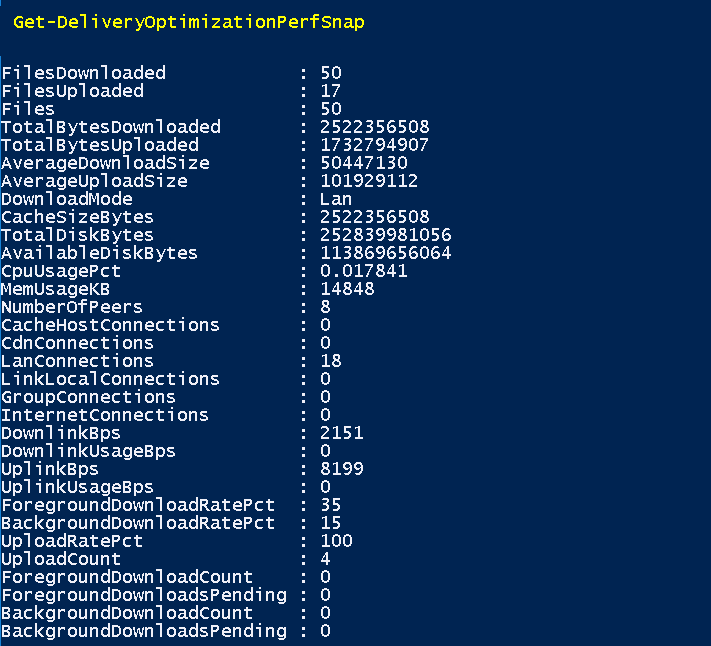
- Get-DeliveryOptimizationPerfSnap
Detailed statistics on the content, including source, data size, and bandwidth usage
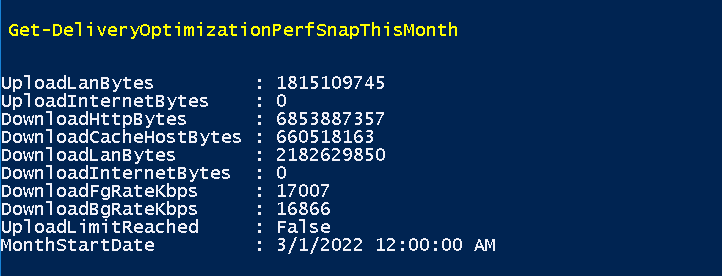
- Get-DeliveryOptimizationPerfSnapThisMonth
Summery of the PerfSnap figures based on an aggregated monthly view
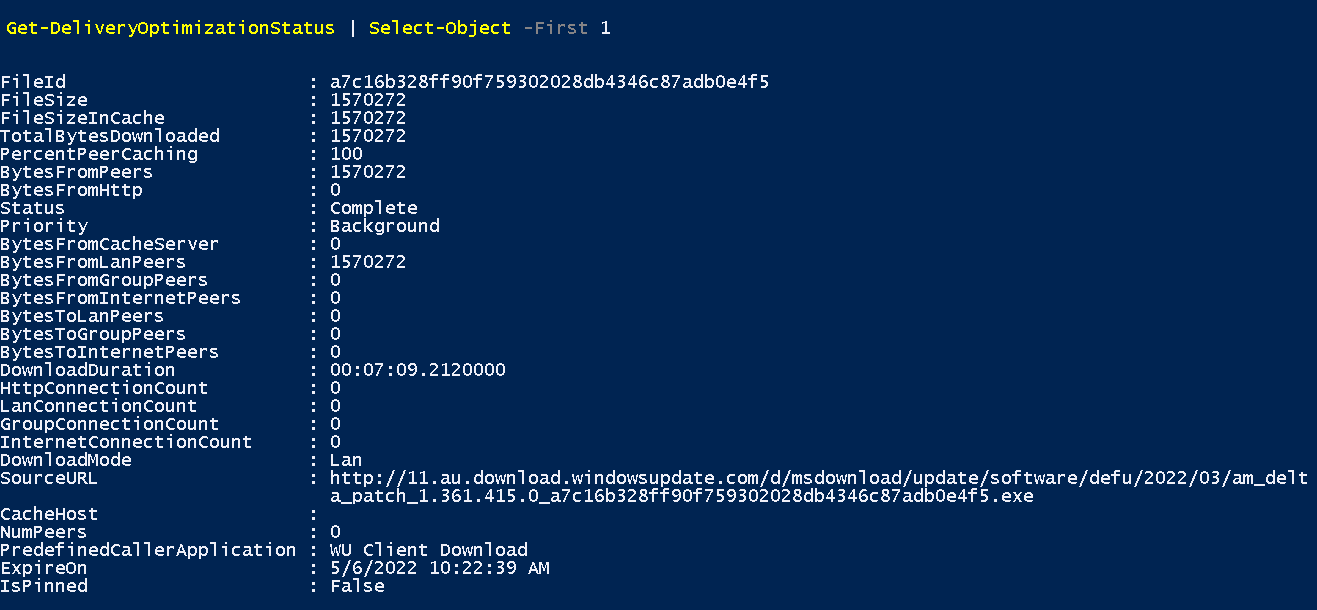
- Get-DeliveryOptimizationStatus
Detailed information on the individual content downloads, including source information, download duration etc
- Enable-DeliveryOptimizationVerboseLogs
This option is only for Windows 10 2004 and higher, providing full verbose logging
Using these cmdlets we can quickly ascertain if our DO policy is working efficiently, however, this is a single runtime action on a single device. With PowerShell we have the ability to collect information from multiple devices, and output to a shared file (csv for example), or even use Proactive Remediations to obtain data and display this in the remediation output.
The output does tend to be text based however, therefore it can be hard to present this to clients / management etc. So what can we do to help visualise the data?
Log Analytics of course is one such option, and this is what we will cover below.
Updated Compliance / Log Analytics
In a previous post I have covered how we can setup and leverage Update Compliance and Log Analytics for Windows Update reporting (Windows Update Compliance Workbook Community Edition – MSEndpointMgr), and in this post we will use those same data sources, but we will focus on the DO statistics in order to generate a KQL workbook.
The logs we will be focusing on are the WUDOStatus and WUDOAggregatedStatus logs, which as you might of guessed from the naming convention, contain information about Windows Update Delivery Optimization.
NOTE
For some reporting elements we will also be using joins to logs providing additional information, the IntuneDevices log for instance can be leveraged if you have opted out of sending through the computer name in your Update Compliance configuration.
Getting Started
Running a query to return all values against the WUDOStatus log, we quickly see something that looks familiar to the statistics we observed in PowerShell;
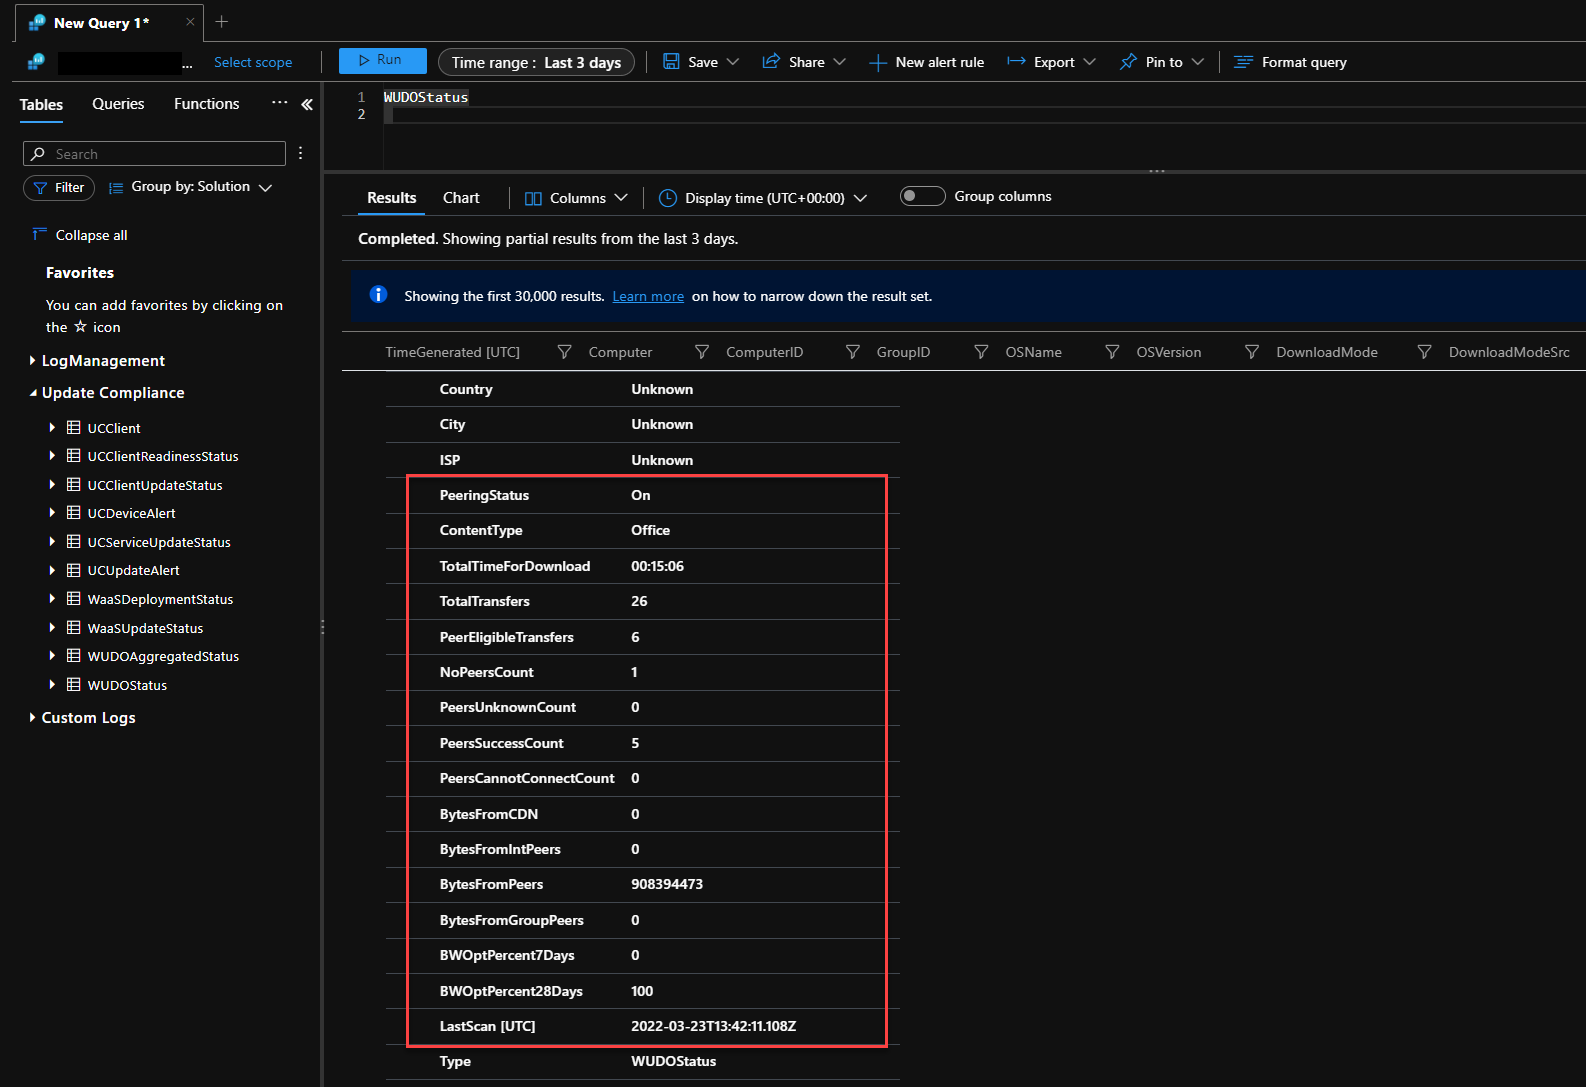
So far, so good, and this is far easier than running scripts out to devices. What about grouping the data? Using the below query we can then being to display the split of content types, so we can get a clearer understanding about the data;
WUDOAggregatedStatus
| summarize arg_max(TimeGenerated, *) by ContentType
| project ContentType, BytesFromCDN, BytesFromPeers
| sort by BytesFromCDN
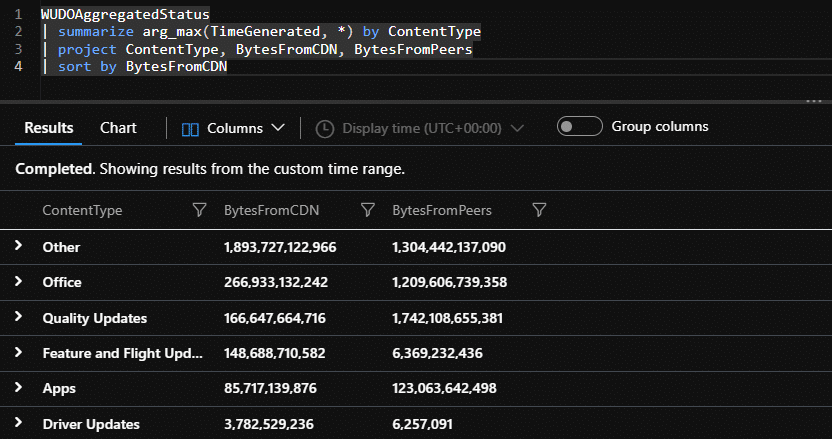
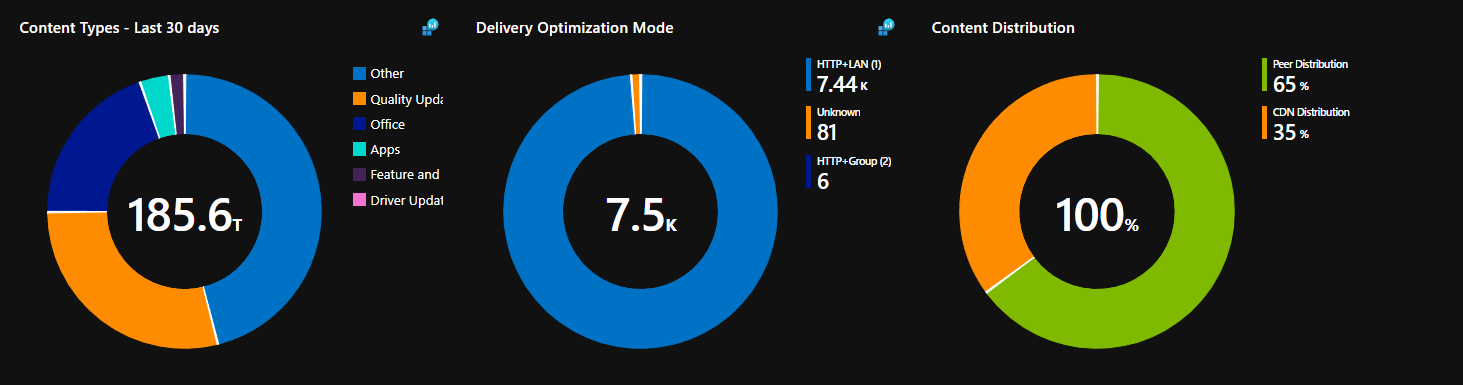
Adding an additional line to render a piechart, we then have something that we can understand in more of visual way;
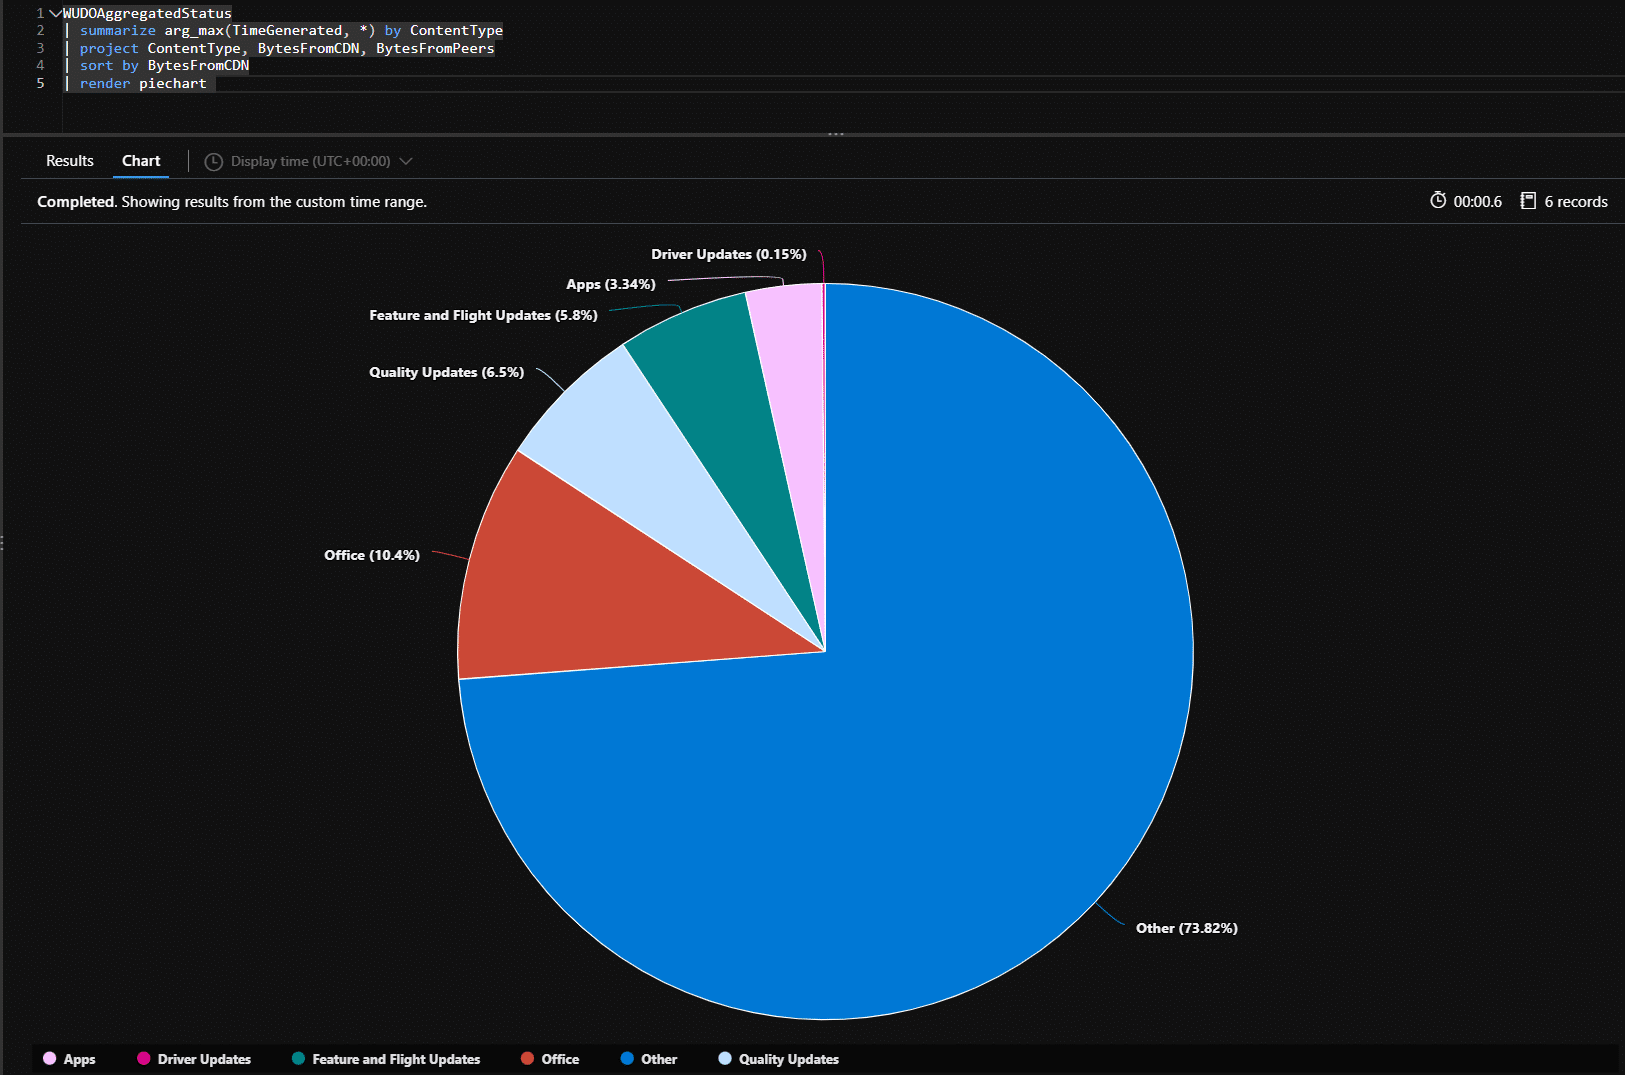
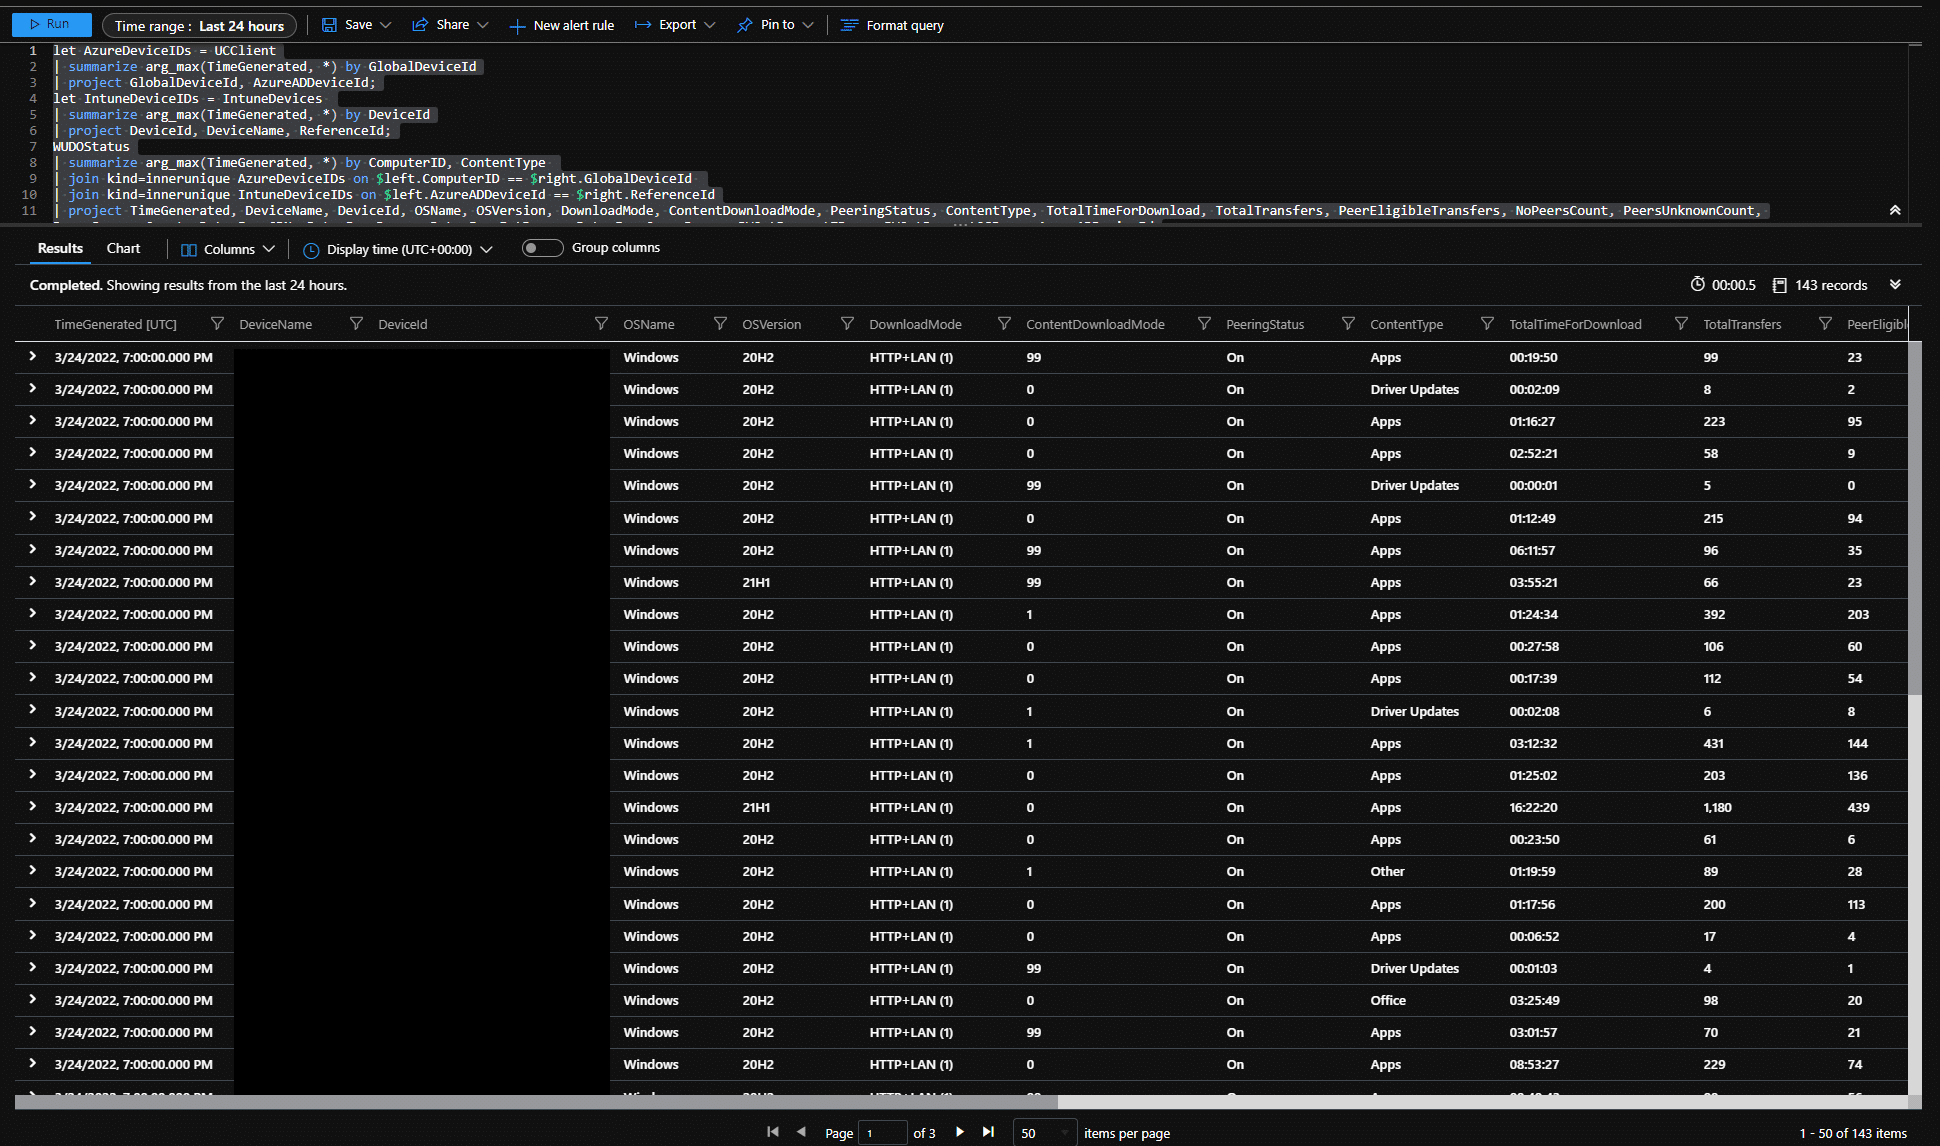
Using more complex queries with joins, we can obtain more detailed information. In the below example the query is returning detailed values for the DO mode, peering state, download duration etc;
let AzureDeviceIDs = UCClient
| summarize arg_max(TimeGenerated, *) by GlobalDeviceId
| project GlobalDeviceId, AzureADDeviceId;
let IntuneDeviceIDs = IntuneDevices
| summarize arg_max(TimeGenerated, *) by DeviceId
| project DeviceId, DeviceName, ReferenceId;
WUDOStatus
| summarize arg_max(TimeGenerated, *) by ComputerID, ContentType
| join kind=innerunique AzureDeviceIDs on $left.ComputerID == $right.GlobalDeviceId
| join kind=innerunique IntuneDeviceIDs on $left.AzureADDeviceId == $right.ReferenceId
| project TimeGenerated, DeviceName, DeviceId, OSName, OSVersion, DownloadMode, ContentDownloadMode, PeeringStatus, ContentType, TotalTimeForDownload, TotalTransfers, PeerEligibleTransfers, NoPeersCount, PeersUnknownCount, PeersSuccessCount, BytesFromCDN, BytesFromPeers, BytesFromIntPeers, BytesFromGroupPeers, BWOptPercent7Days, BWOptPercent28Days, AzureADDeviceId
| order by TimeGenerated, DeviceName desc
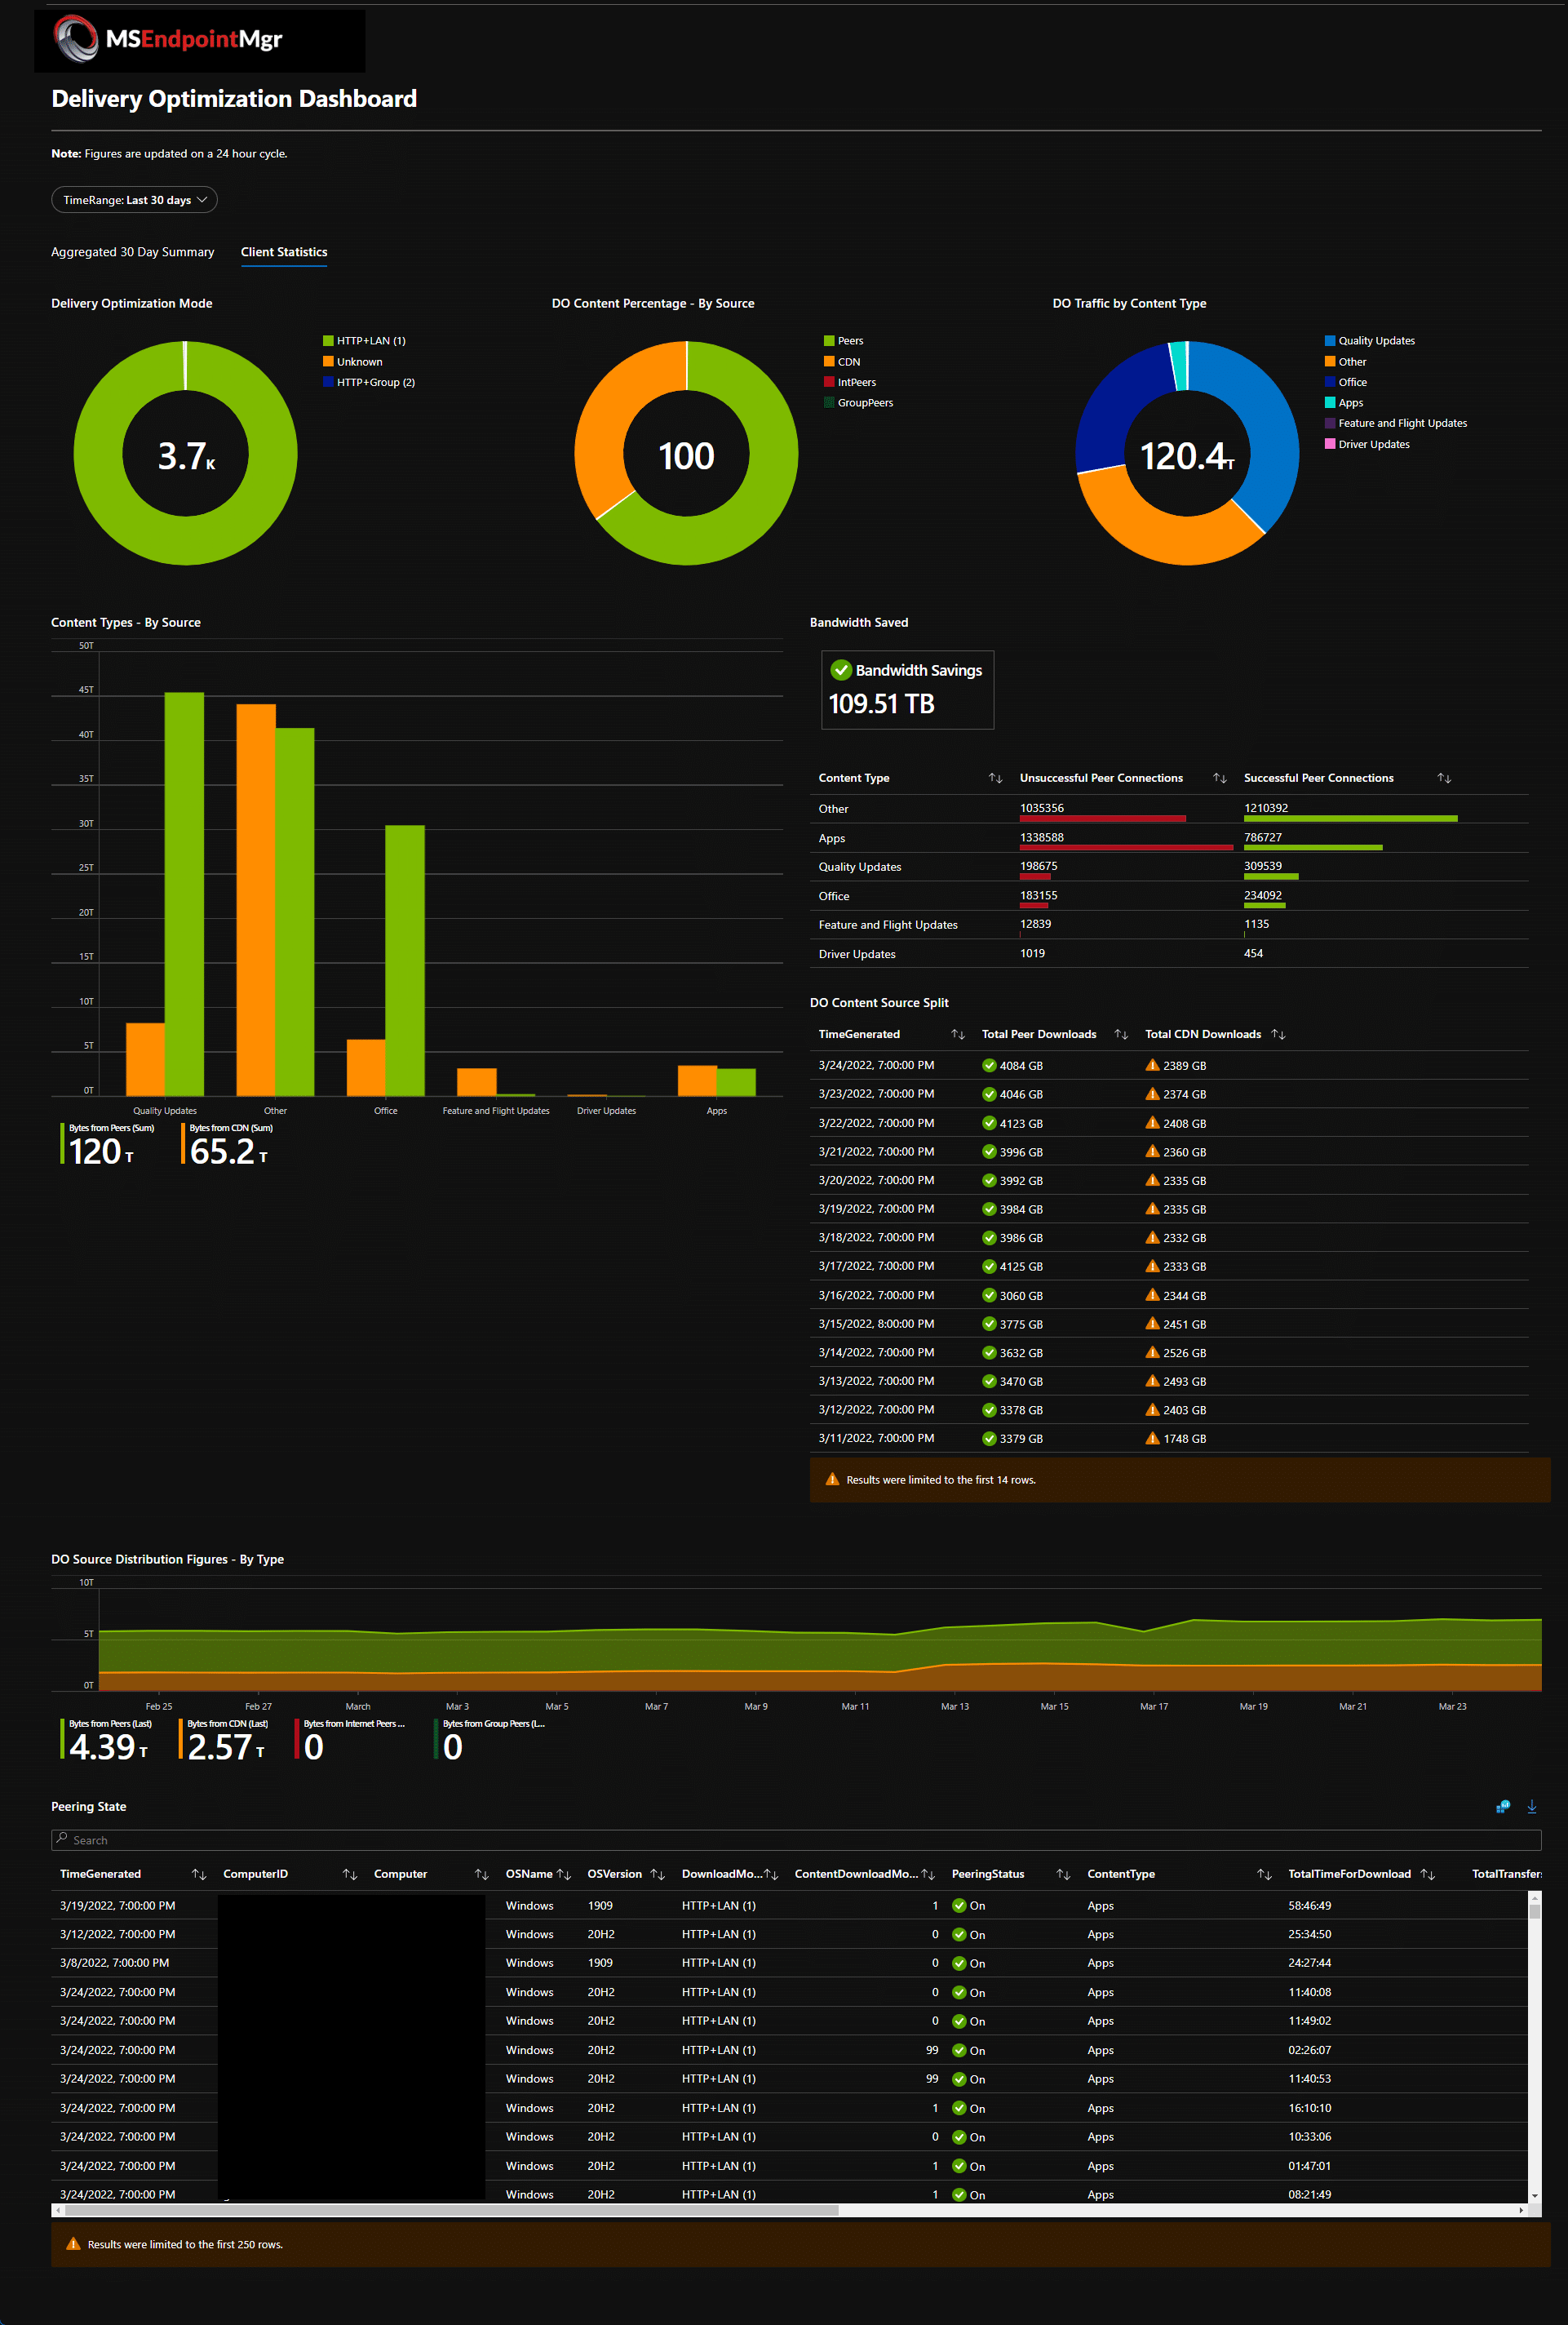
Delivery Optimization Workbook
Running queries and having their output projected in a query is of course useful, but we can take this on a step and build a workbook to contain many related elements. This is what I have done, so you can get a clearer understanding of your DO traffic, from successful or unsuccessful connections, to the data throughput, and most thing’s in-between are covered. Below is a list of the elements
- Content Type Summary
- Delivery Optimization Mode Summary
- Content Distribution Percentage Split
- Detailed Content Type – By Bytes
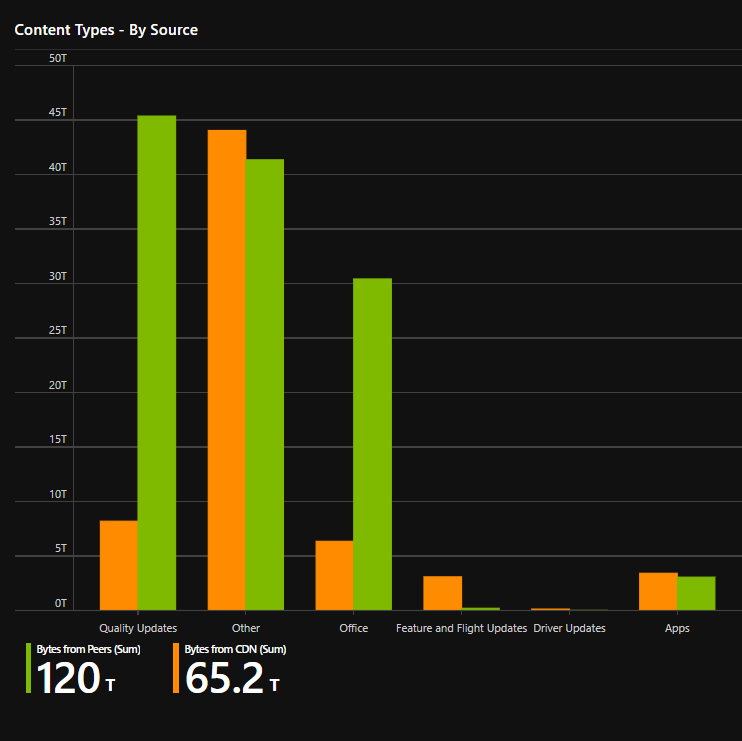
- Content Type Summary – By Source
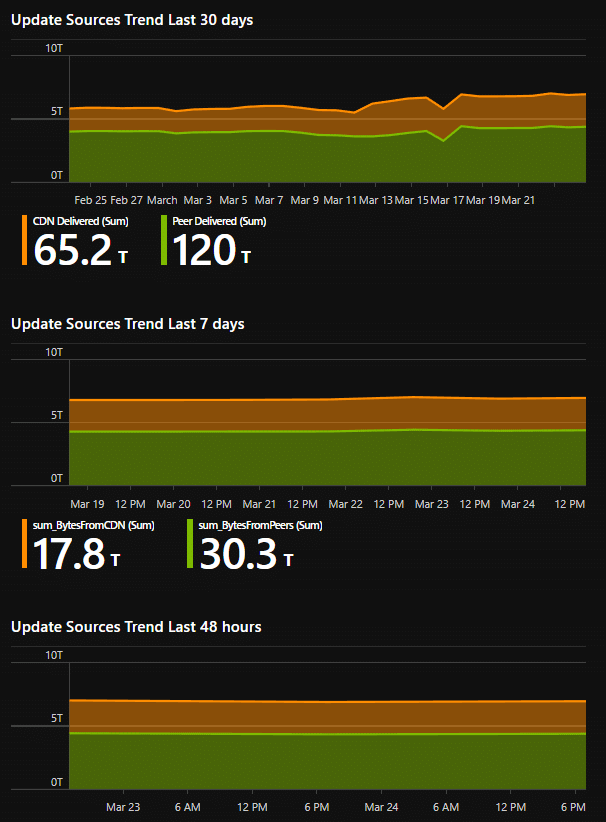
- Update Source Trends – 48h / 7d / 30d
- Delivery Optimization Bandwidth Saving
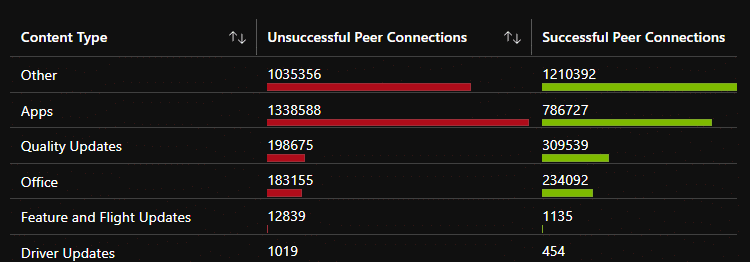
- Peer Connection State – By Content Type
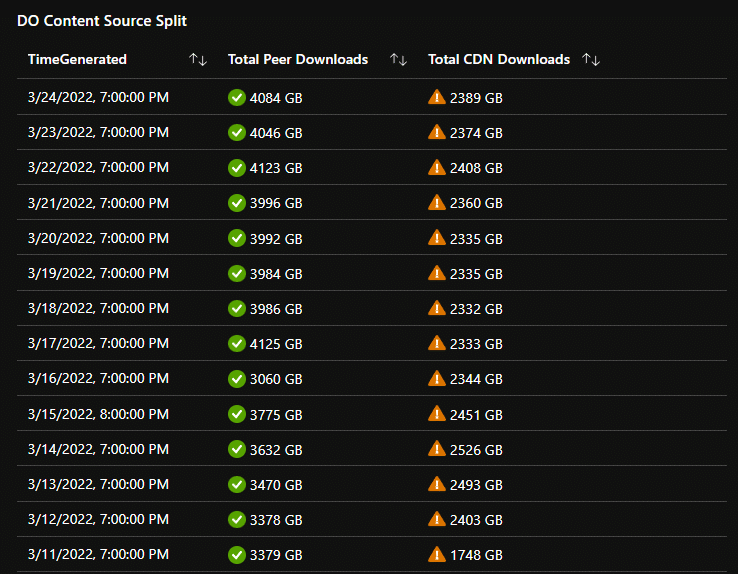
- Delivery Optimization Content Size – Peer / CDN
- Trendline – DO Content Source
- Device Peering State


With all of these elements together, we end up with dashboard that looks something like the below;
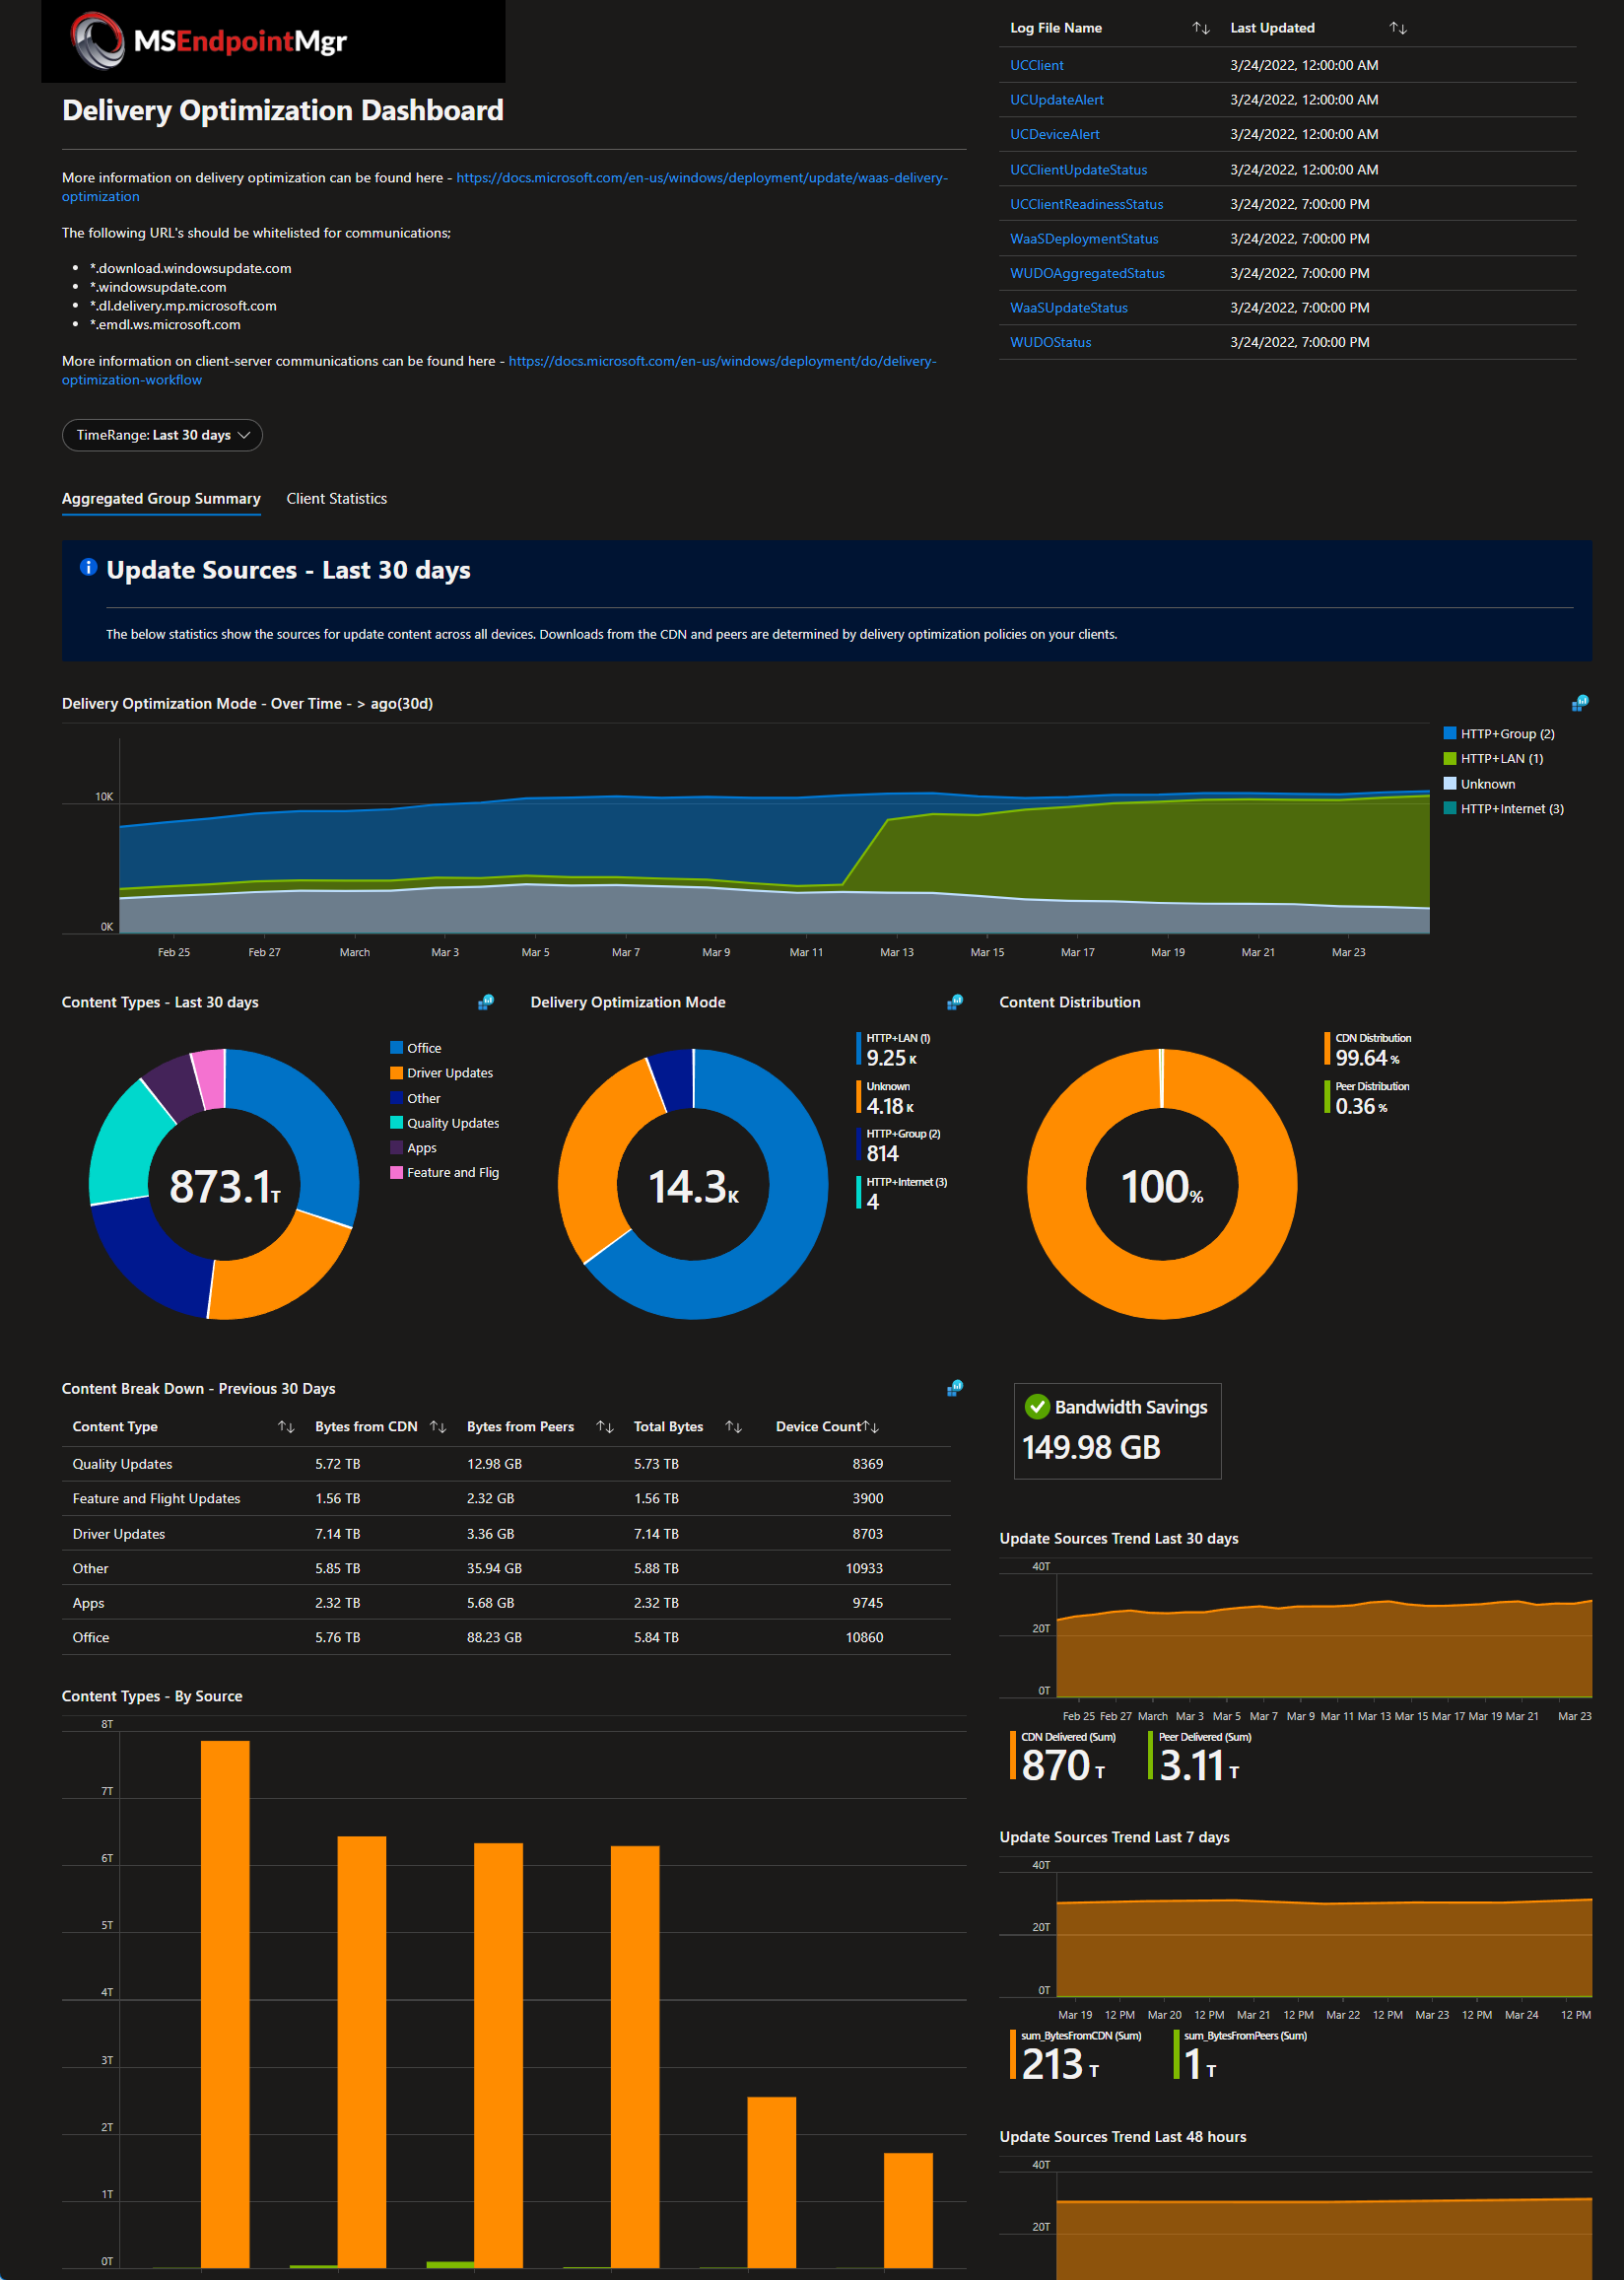
If this looks like it could be useful to you, then simply go to the MSEndpointMgr GitHub (Reporting/DeliveryOptimizationDashboard.json at main · MSEndpointMgr/Reporting (github.com)) and download the JSON code behind it.
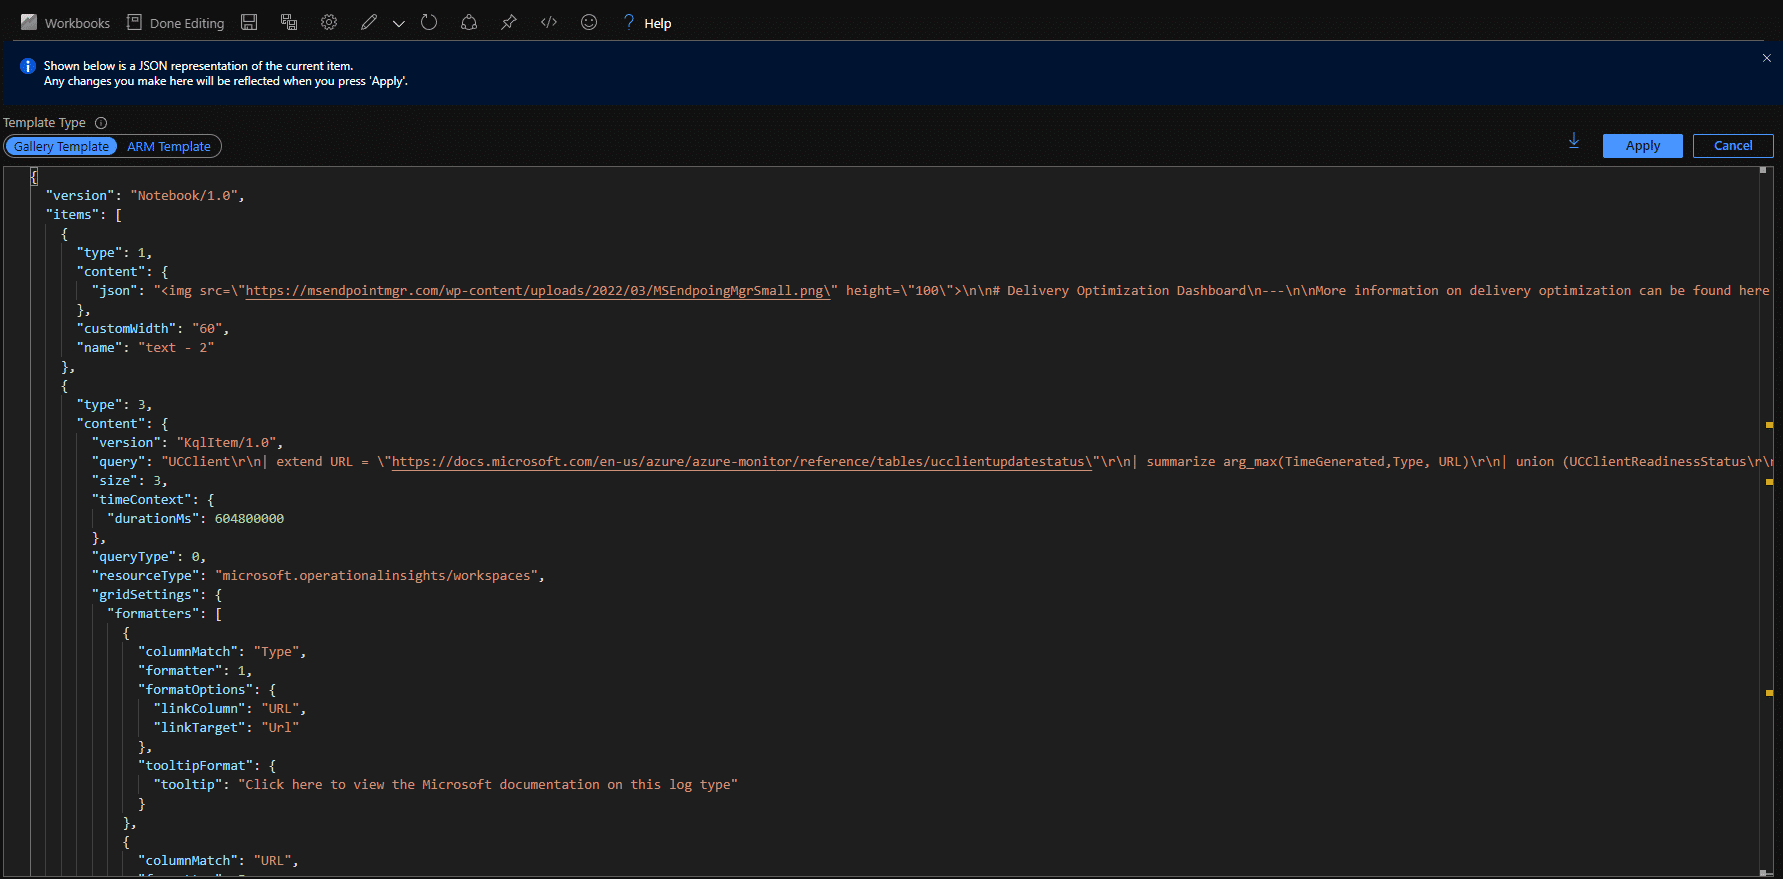
Add the JSON to a new workbook, making sure you link the log analytics workspaces for your Update Compliance and Intune logs, and viola you have a dashboard. You can also change the logo to your corporate banded logo if you wish 😉
Conclusion
Delivery Optimization is one of those features that can provide much needed efficiency to your networks, and I hope with this dashboard it will get you on your way to understanding what, where, and how content is delivered in your environment.


Add comment