

Introducing the MSEndpoingmgr Intune Audit Dashboard, a KQL workbook to make your life a little bit easier when it comes to auditing events in your Intune environment.
Auditing Events You Say…
Auditing, love it or hate it, provides an integral part of your infrastructure when it comes to the who, where, and why of what is going on. I’m sure many of you will have examples over the years where a colleague or an external consultant has changed something in your environment, resulting in something, somewhere going bang. On the flip side I know I have used these logs to prove it wasn’t me, so they can be your saving grace right when you need them.
Intune Audit Logs
Traditionally though audit logs are often overlooked, or when you go to use them, you might find that they appear to be difficult to work with. When it comes to Intune, we find the audit logs in the “Tenant administration” blade, and when we start to filter the actions, we can quickly see that for some admins the poses a challenge.
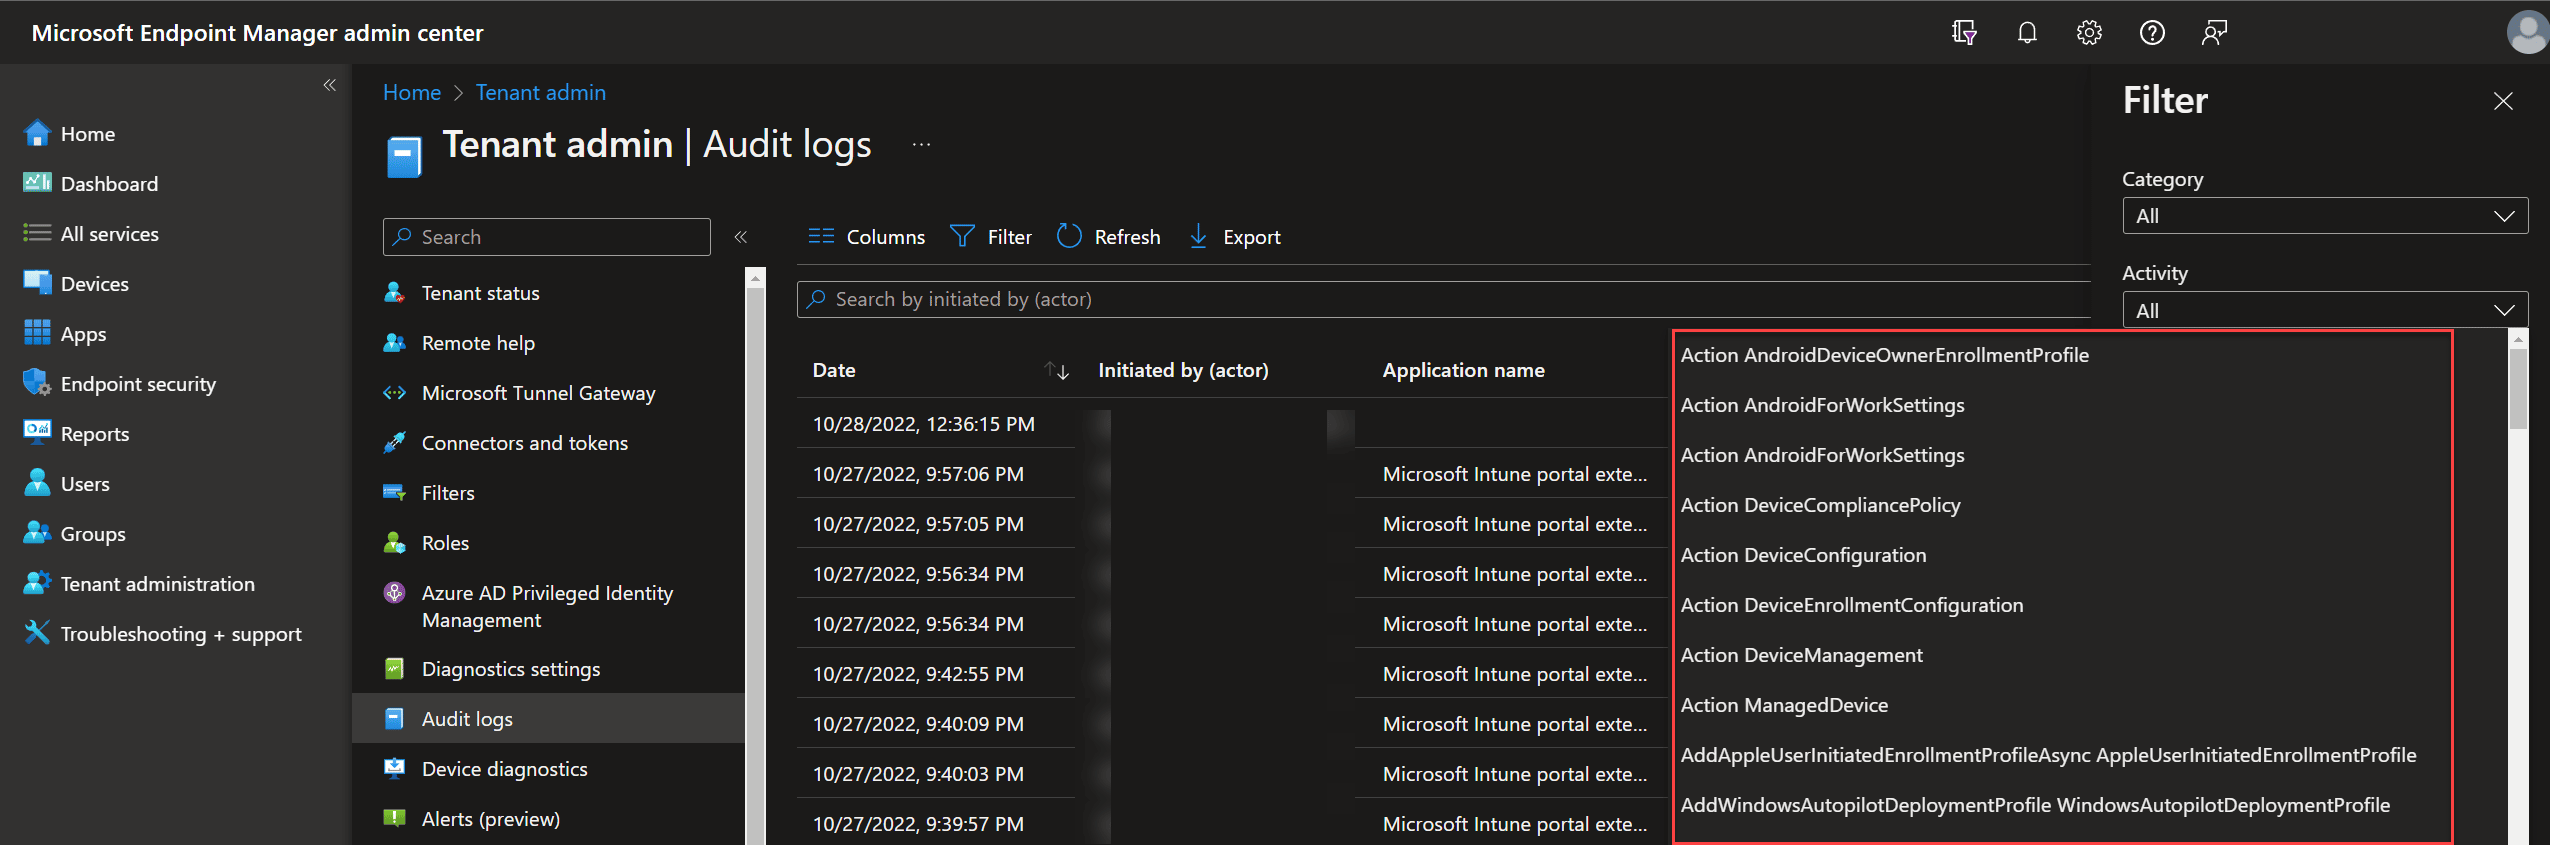
Which event should I search for? Which object ID was targeted? Unless you are using these logs regularly it came be less than intuitive at times to find that smoking gun. This is the kind of feedback we hear, and we wanted to do something about it.
First things first though..
Diagnostic Settings / Log Analytics
When setting up a tenant, the first thing I would always do is enable the diagnostic settings. The reason for this is simple, I want to have the logs available in a format that I can interrogate easily, and also control the retention of data within.
If you are not sure of where this is done, it is simple (please note you do need an Azure subscription and at least contributor rights to a log analytics workspace);
- Log into the Intune Admin Portal (yes, I am just calling it this from here on!) – https://endpoint.microsoft.com
- Click on “Tenant administration”
- Click on “Diagnostic settings”
- Clik on “Edit Settings”
- Select the logs you wish to send to Log Analytics;
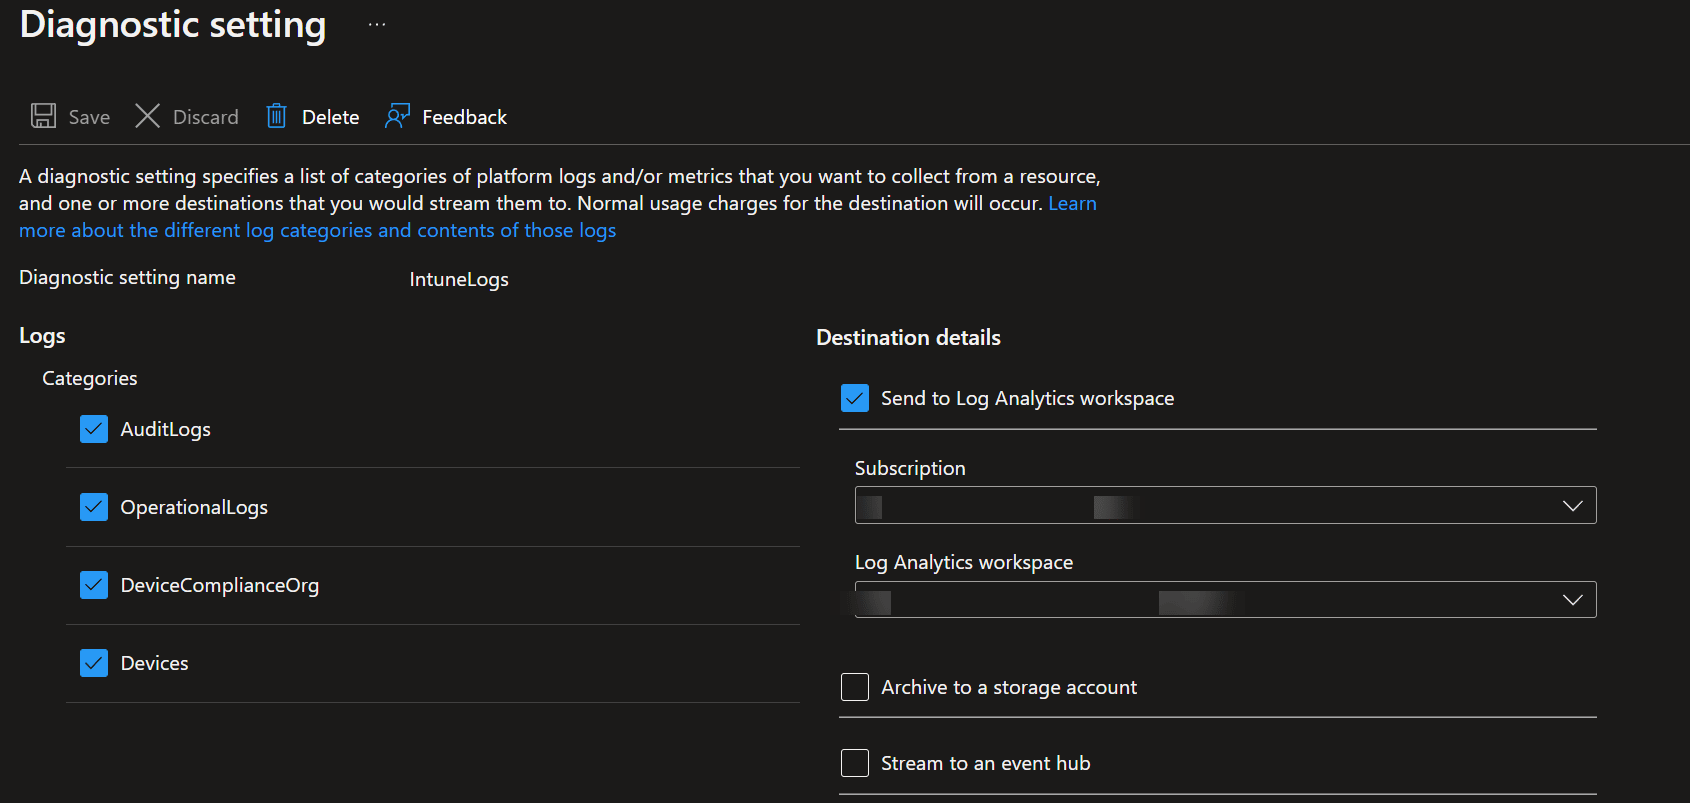
- Click on “Send to Log Analytics workspace”
- Select the Subscription and Log Analytics workspace
- Click on “Save”
Once this is done you will start to see entries forming in the following Log Analytics workspace tables;
- IntuneDevices
- IntuneOperational Logs
- IntuneDeviceComplianceOrg
- IntuneAuditLogs
For the next part of this post, we are going to focus just on the IntuneAuditLogs and IntuneDevices tables, as they will be used to generate a reporting dashboard.
KQL FTW (Yes, Again)
You probably know that we are big fans of KQL, so I won’t bore you with the selling you the why, how, or where, but what I will do is to tell you, you need to start using this. Think of KQL as the new PowerShell, it helps you find and report on data quickly and efficiently.
Looking into the IntuneAudtLogs, we have a wealth of information, where we can quickly search and start to build up a picture about admin actions. This is great if you are familiar with KQL and writing queries, but we wanted to make this easy for you.
This is exactly what we have done, in the form of a KQL workbook that you can drop into your environment. Let us take a look at the latest in our workbook line;
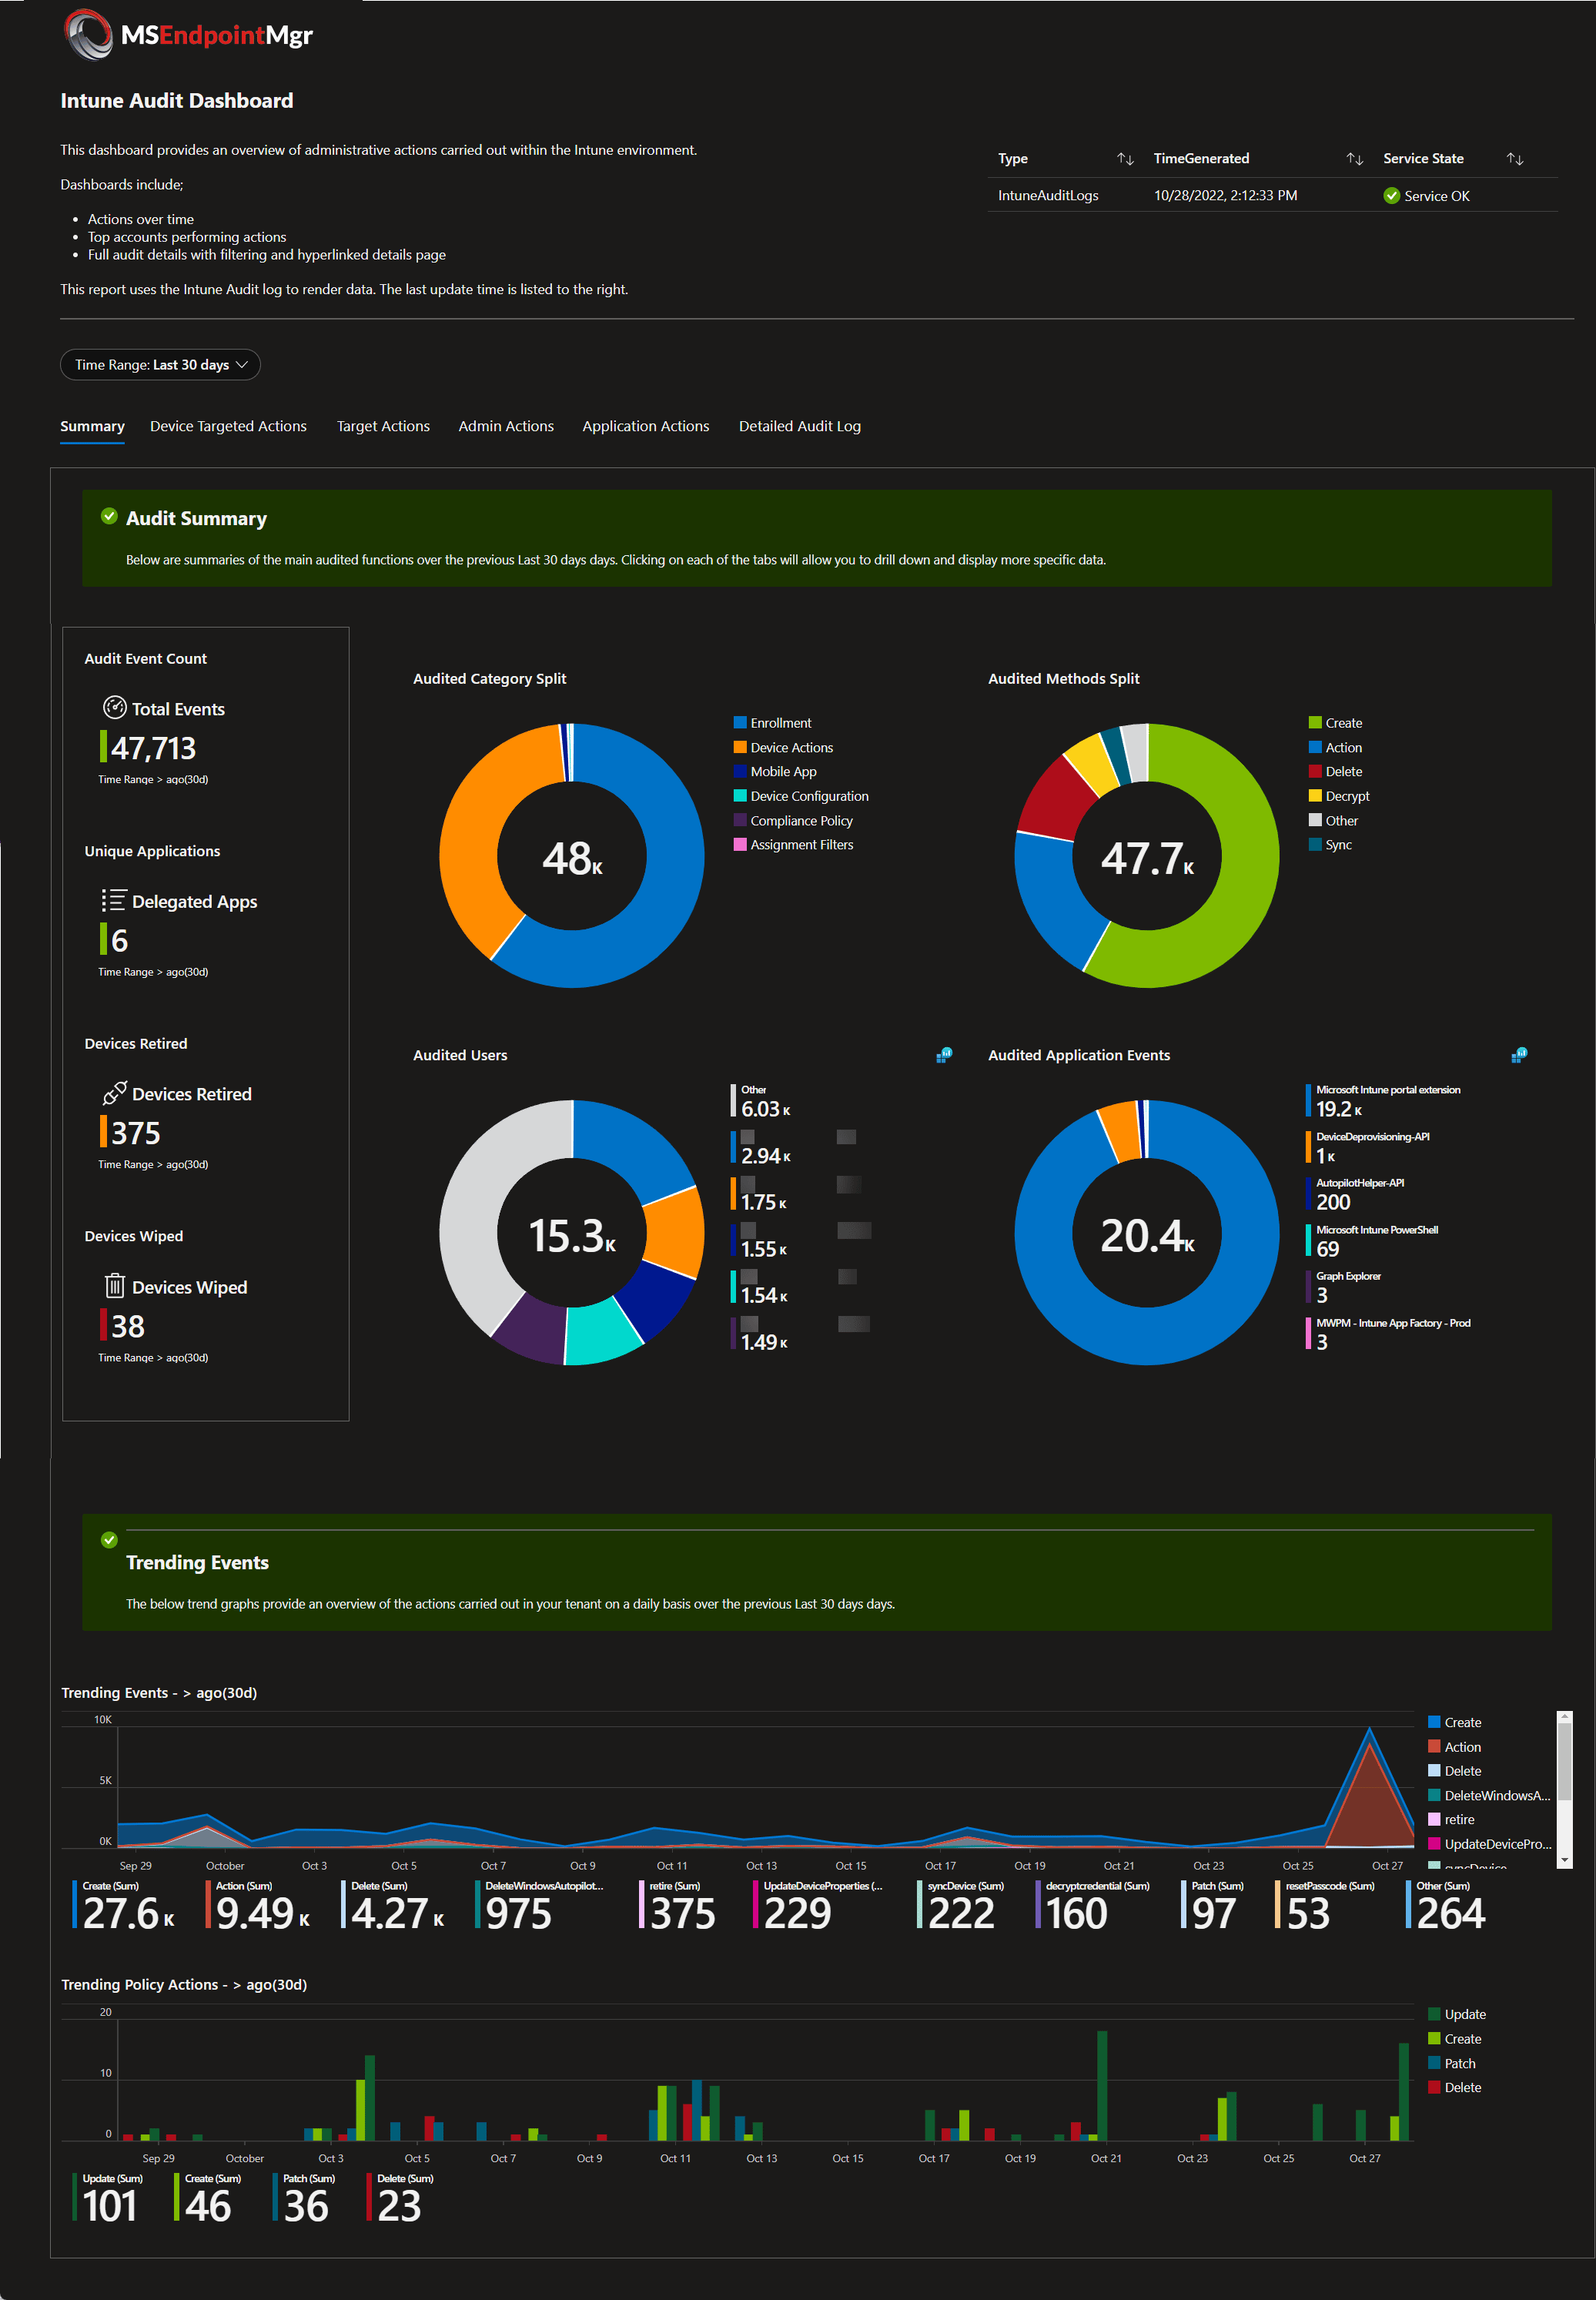
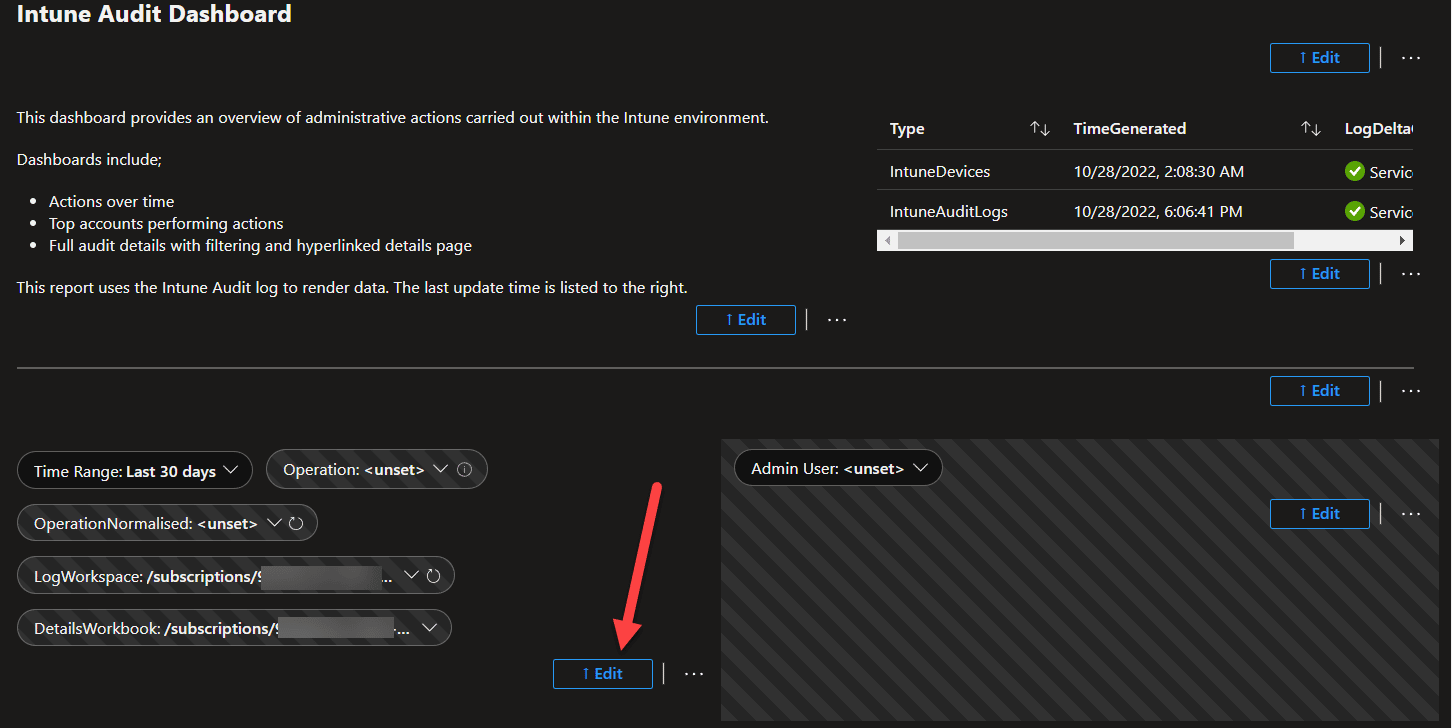
Intune Audit Dashboard
The dashboard is broken up into several key areas;
- Summary
The summary page gives you information such as the split of tasks and methods being undertaken by your admins, along with useful stats and trends
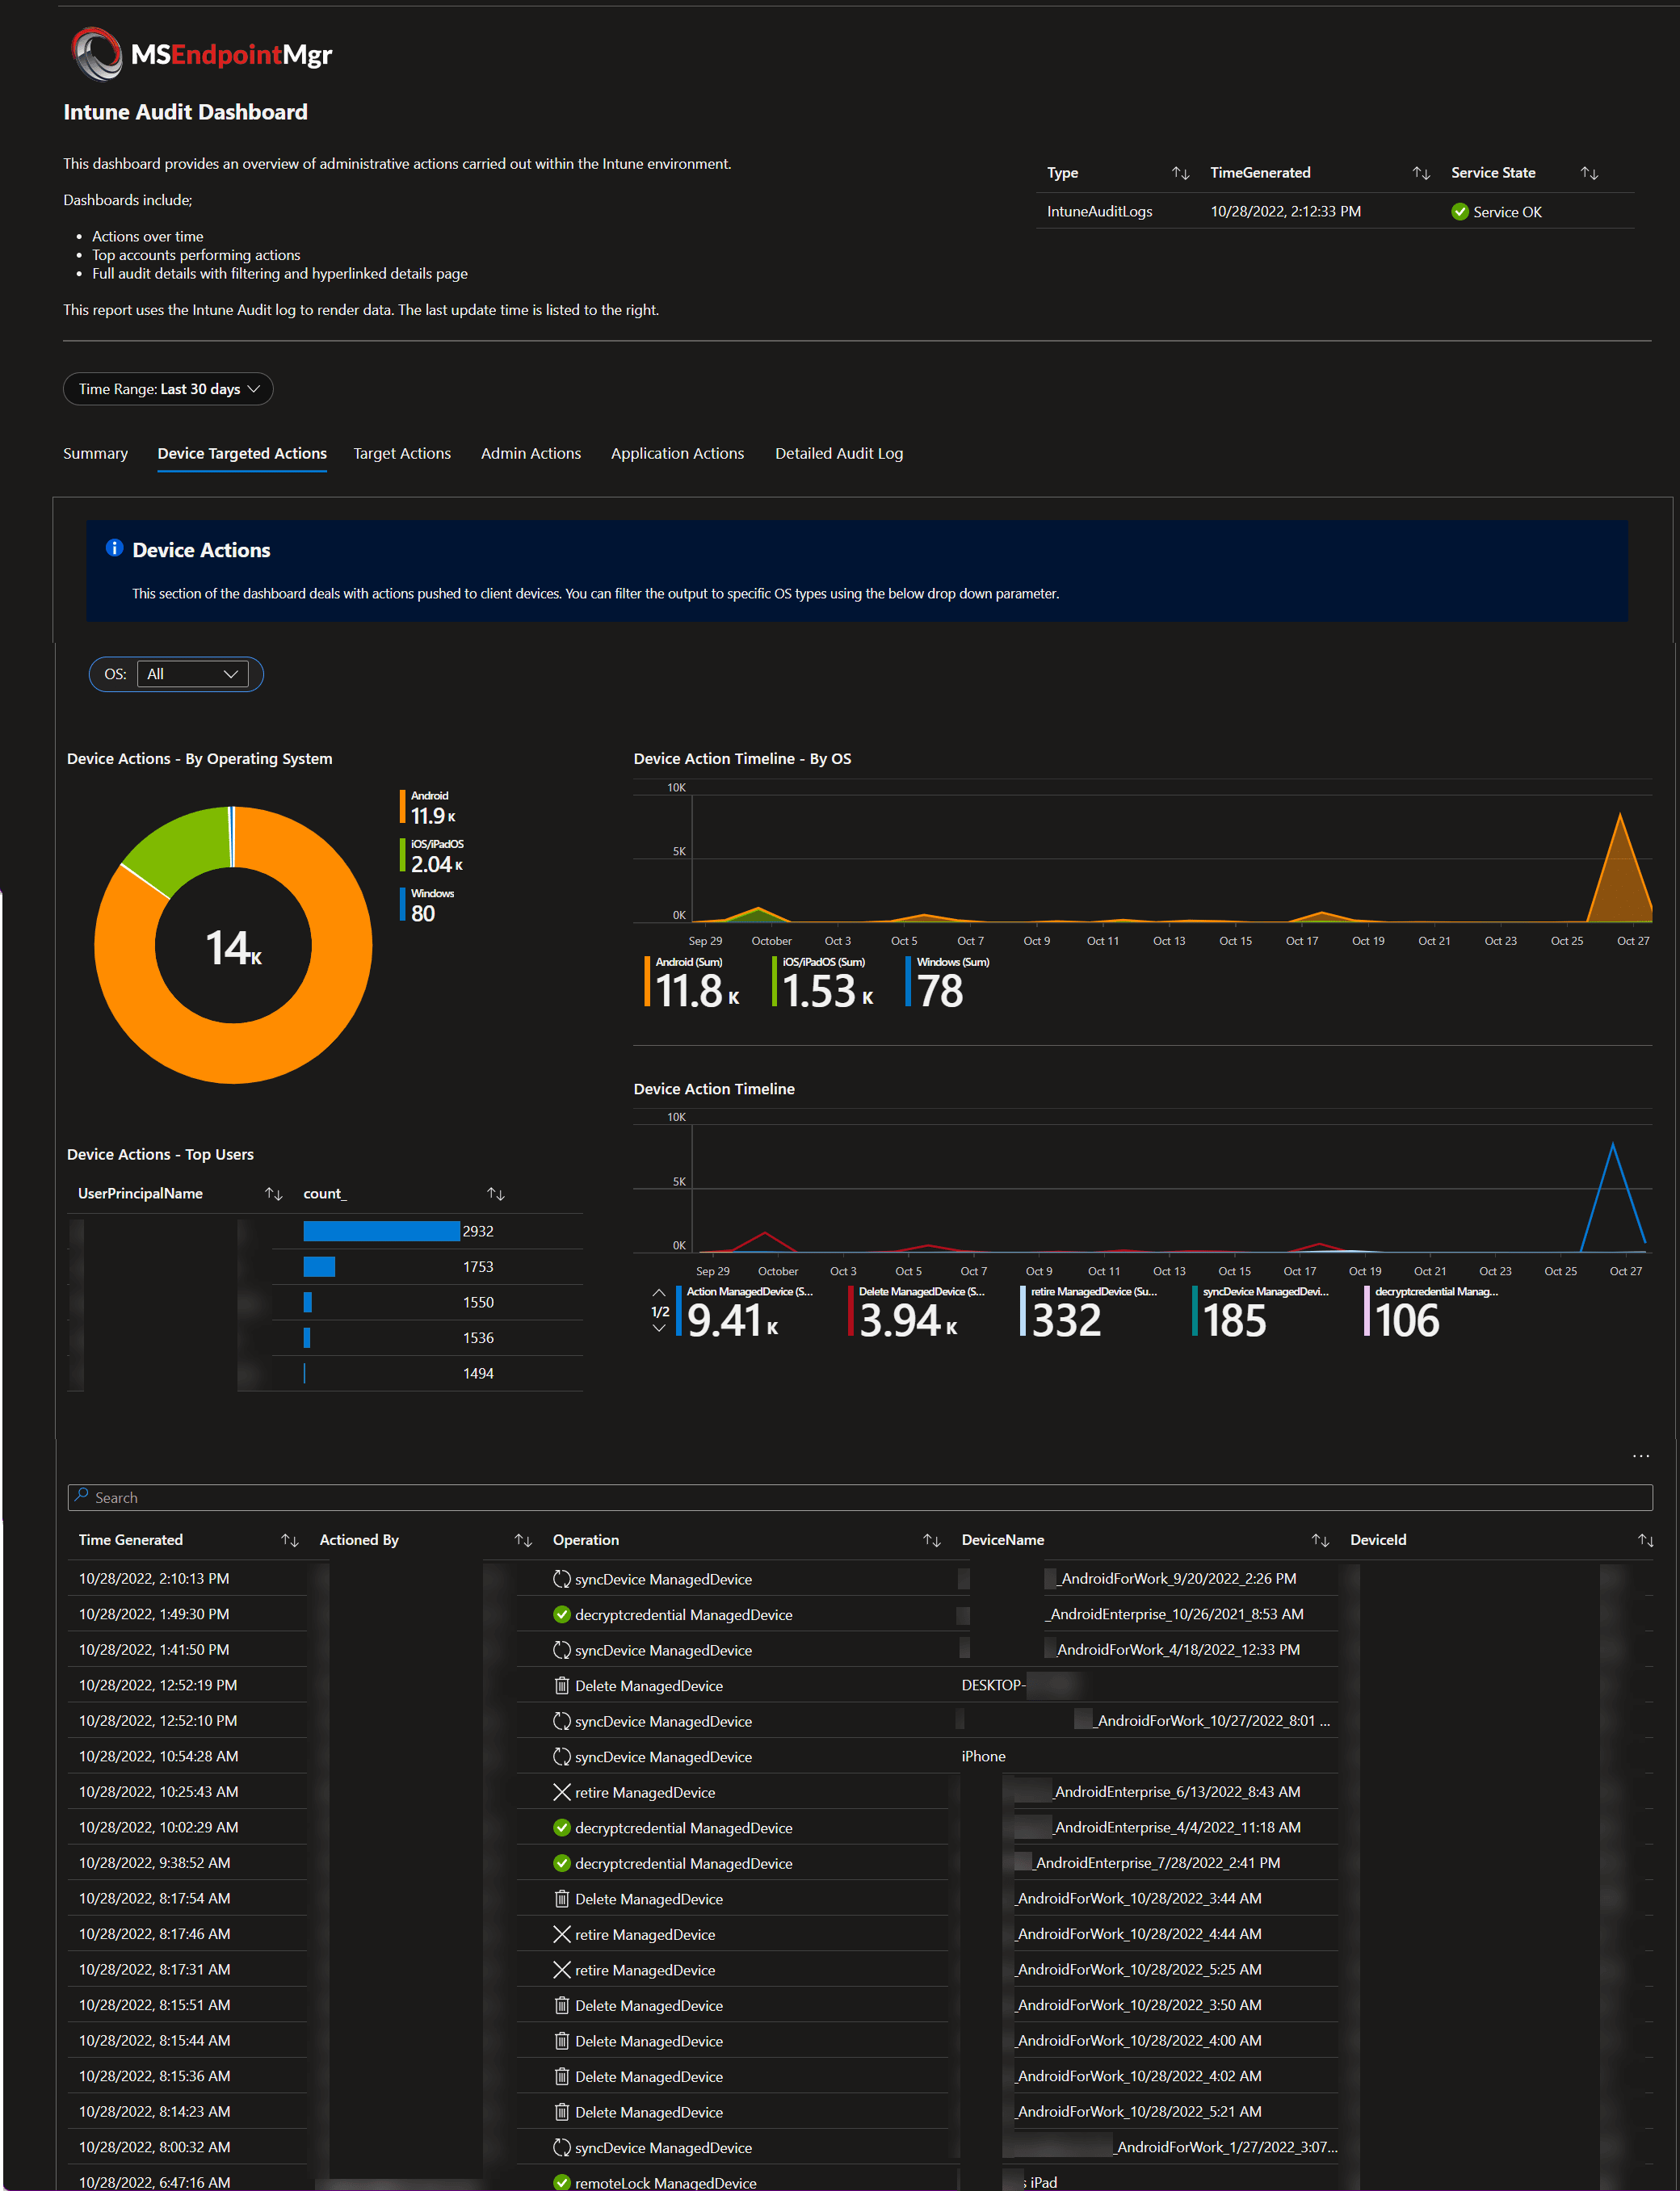
- Device Targeted Actions
This page provides you with an overview of actions impacting on devices, such as wipe, reset, delete etc. Scrolling down you also see the following details;- Time Generated
- Actioned By
- Operation
- Device Name
- Device Id
- Result
- Management Type
- OS
- OS Version
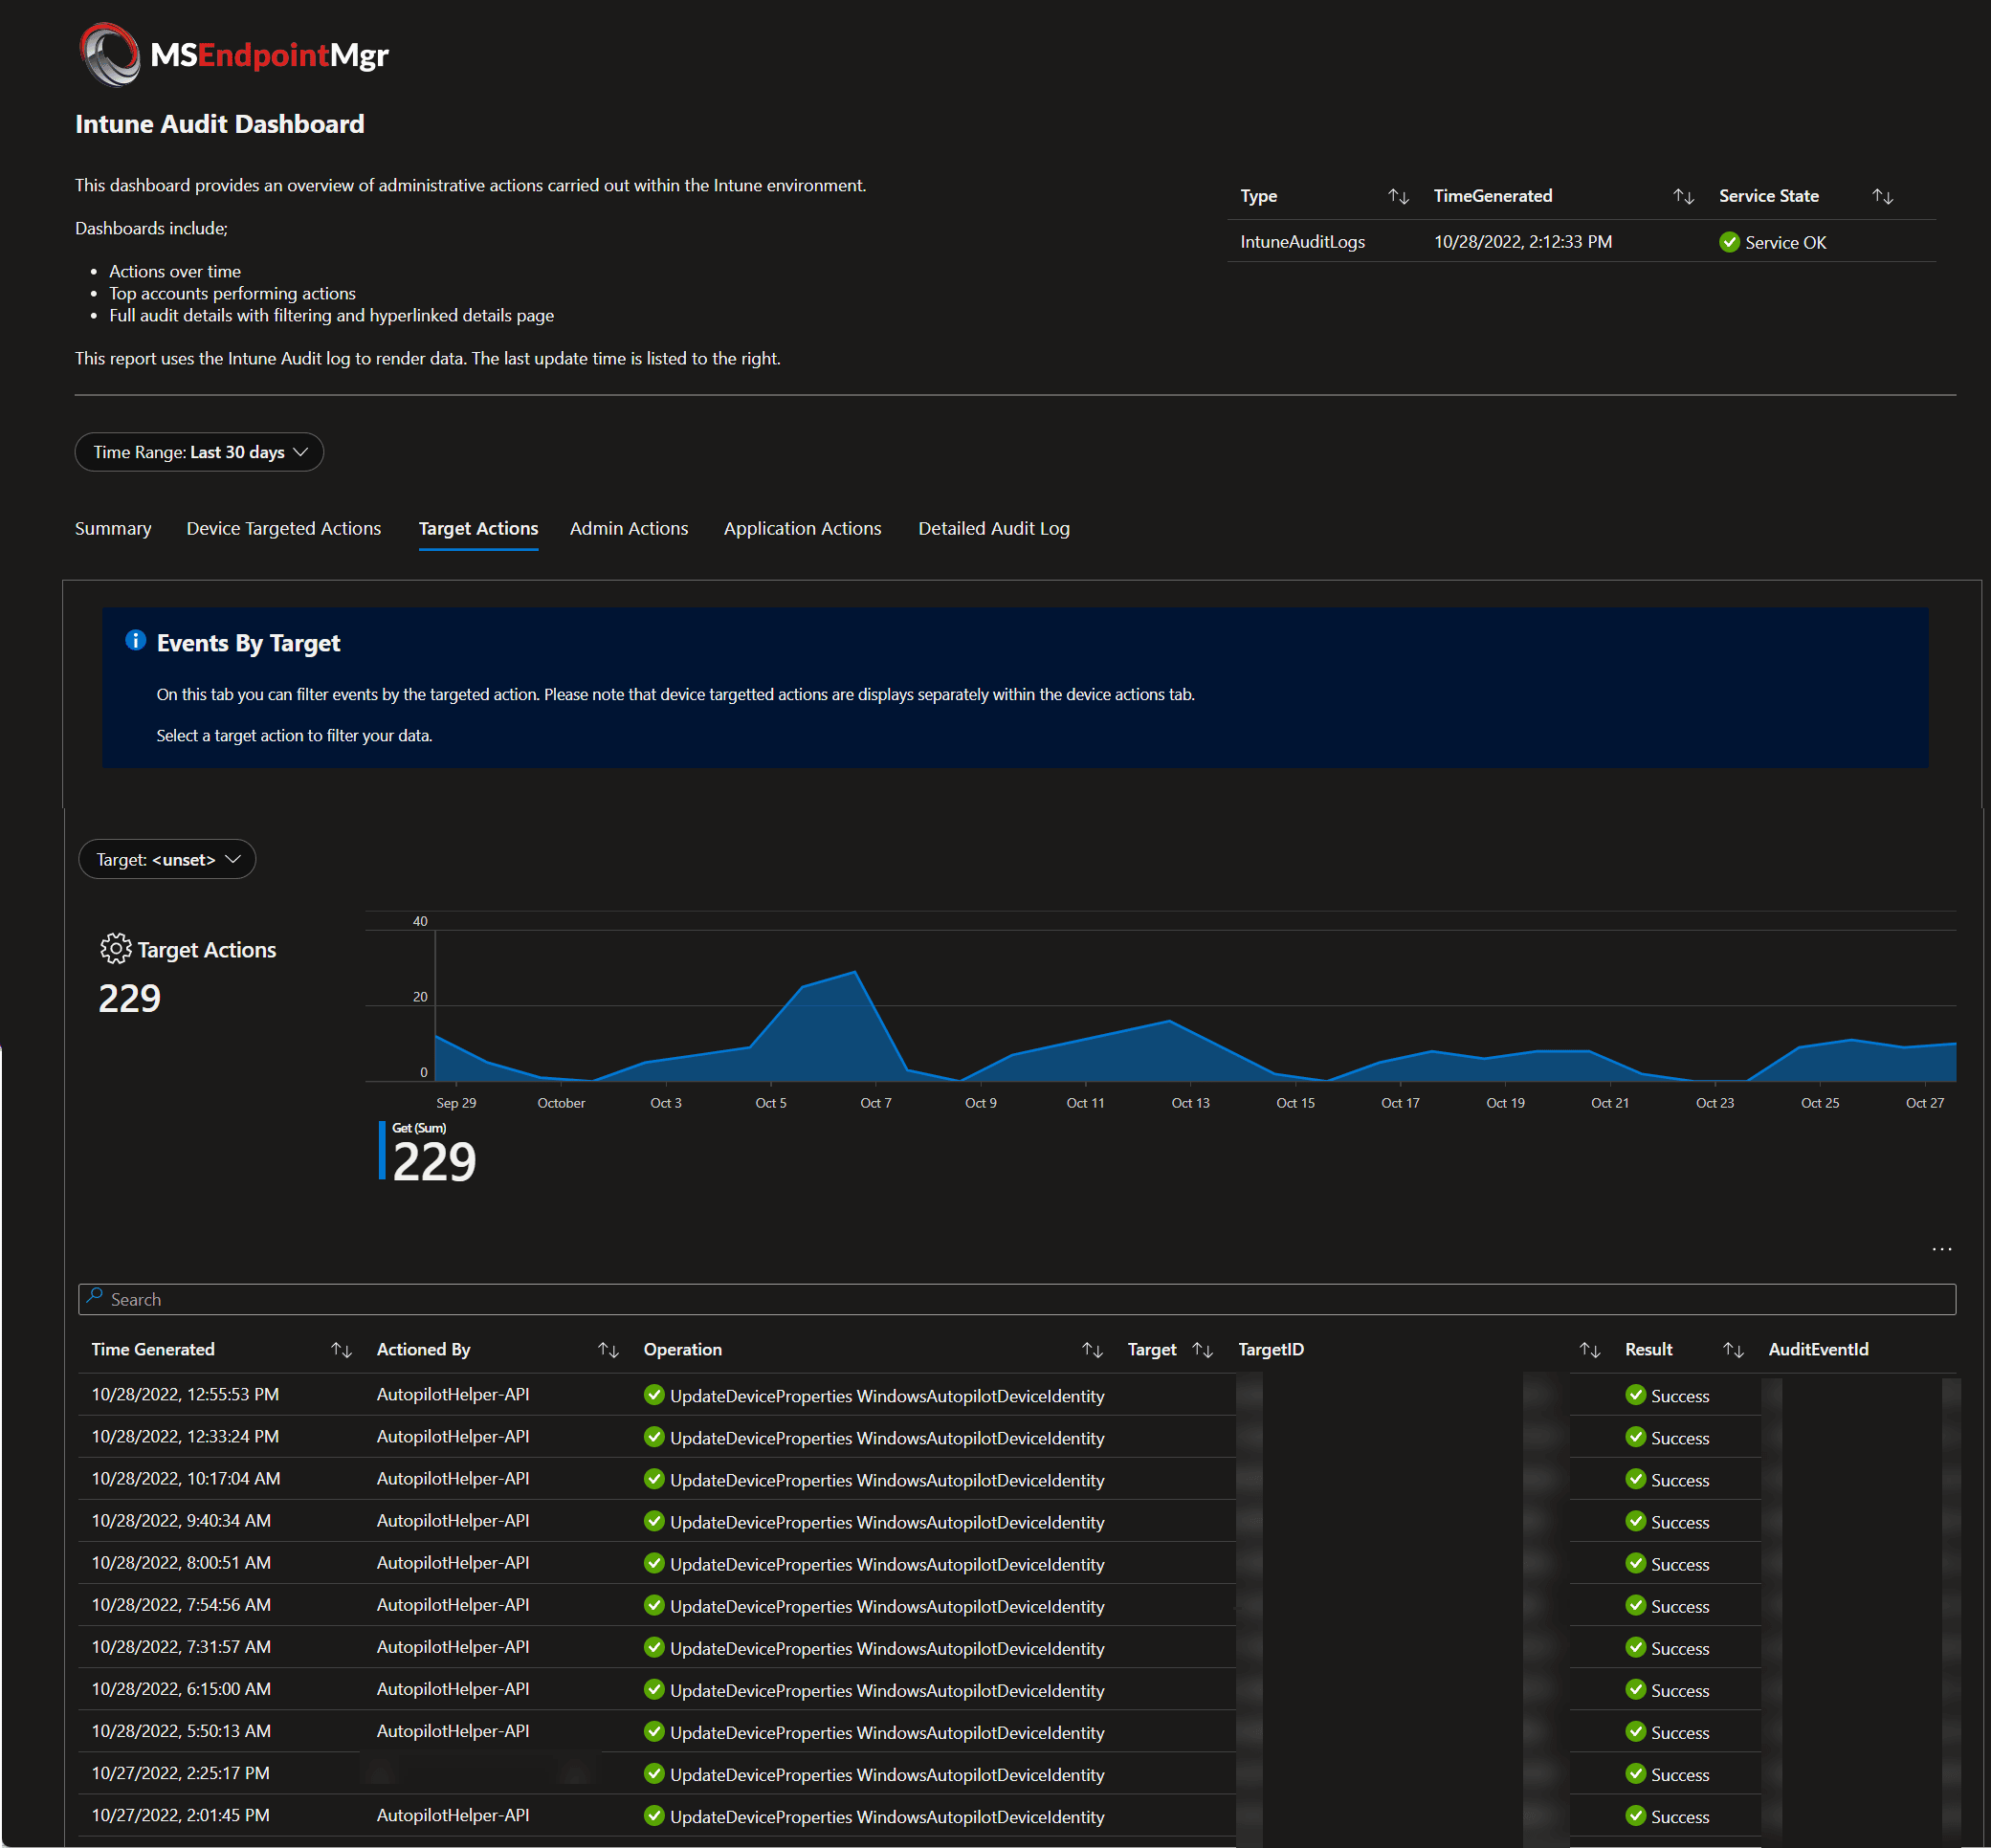
- Target Actions
On this page you will allow you to select actioned based on changes to policies, configurations etc
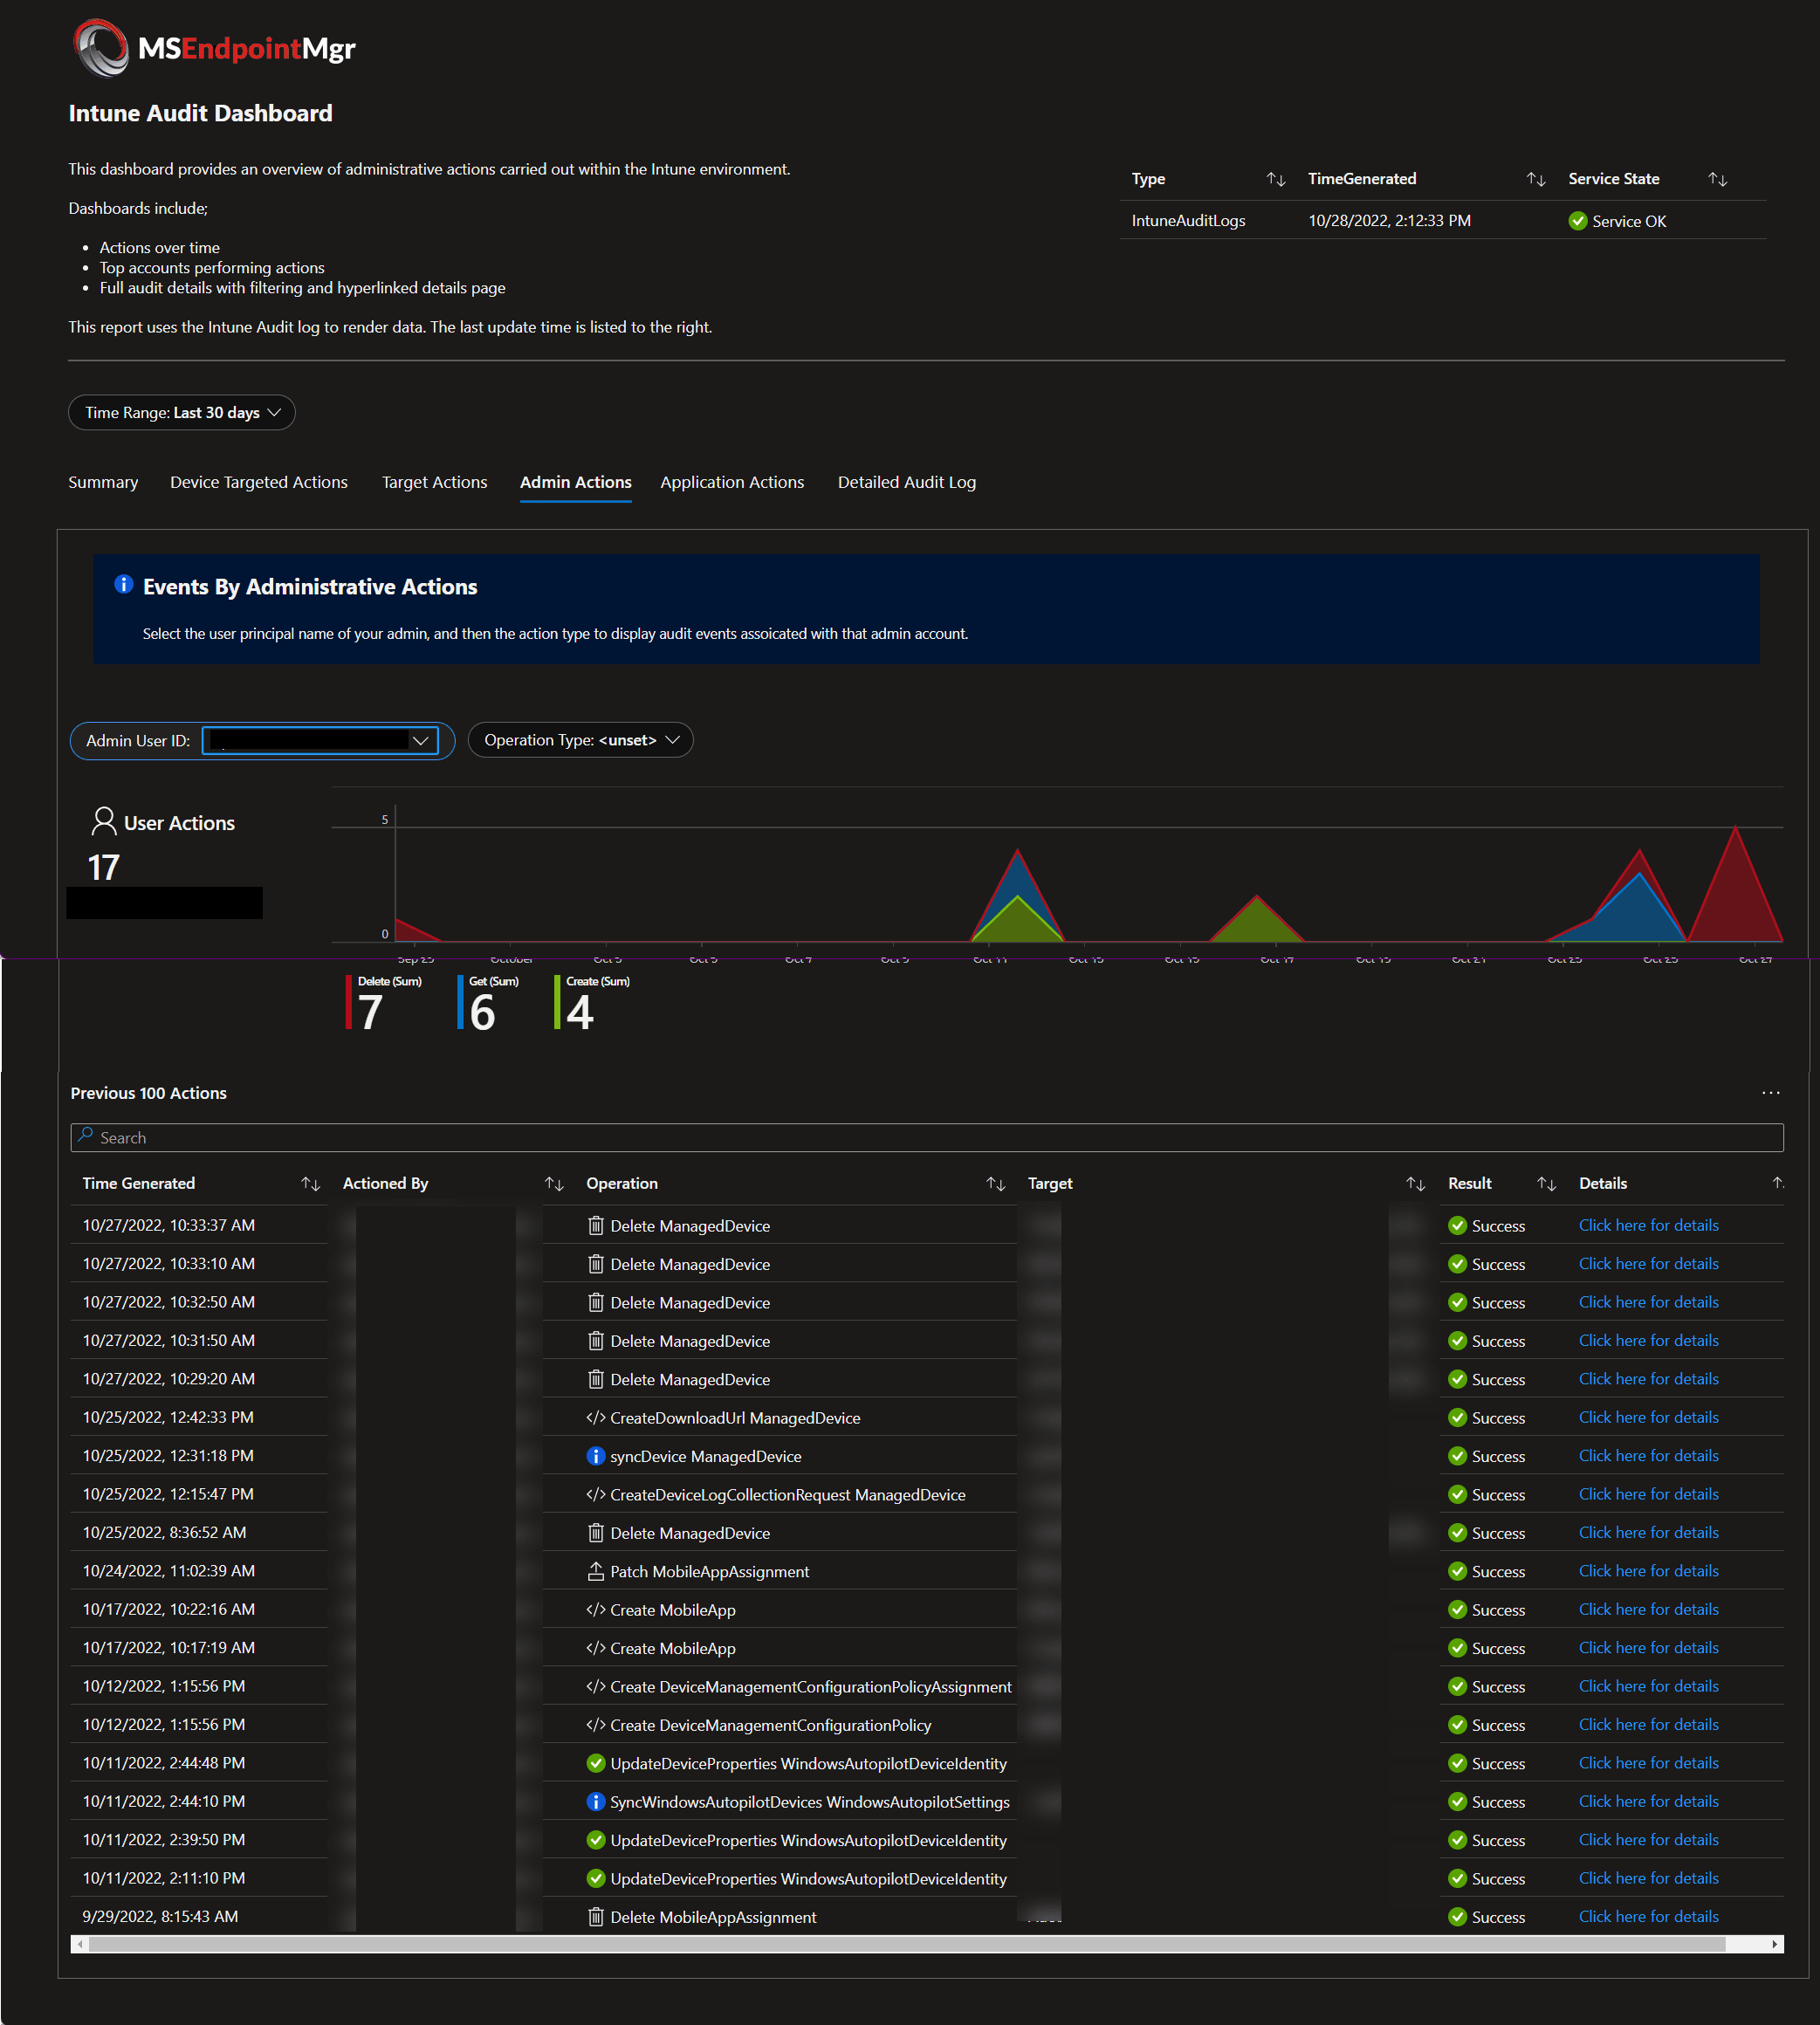
- Admin Actions
Filter based on the actions of a particular admin
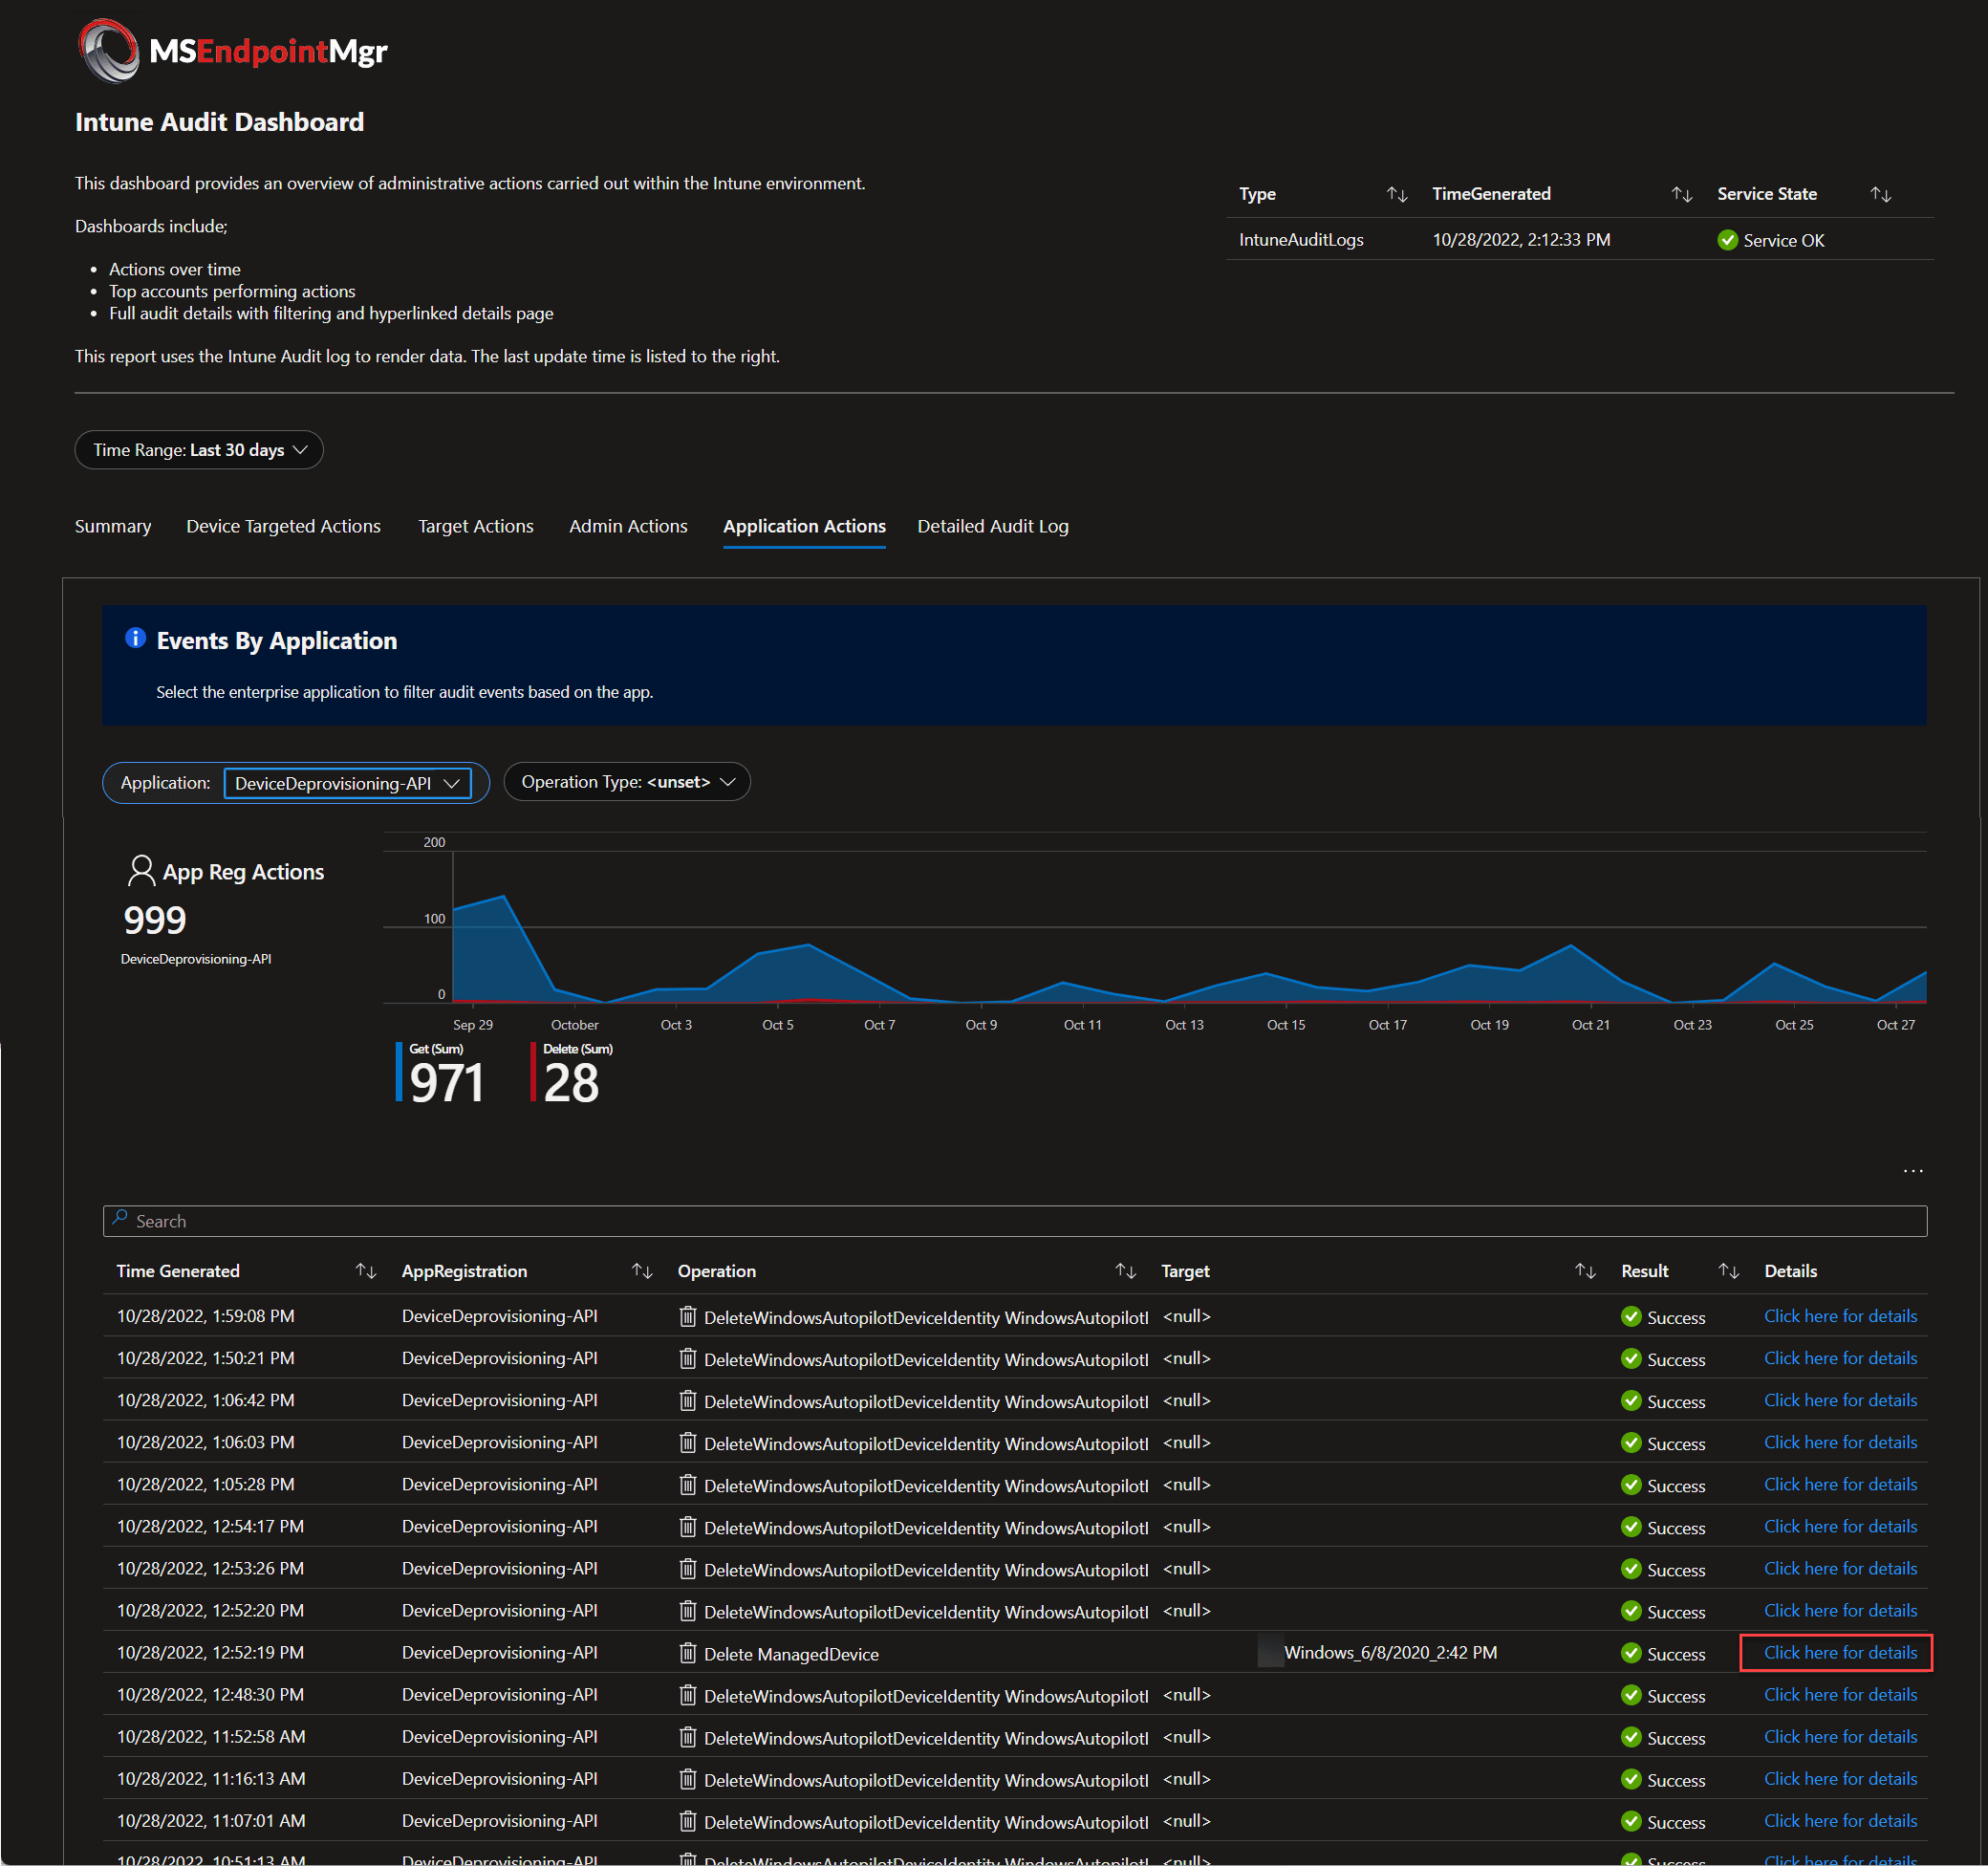
- Application Actions
Filter based on the actions of a delegated application
- Detailed Audit Log
The full detail of everything
More Details Please
Within the “Target Actions” and “Admin Actions” pages you will also see links to display additional information about the change event, such as in the example below;

Where audit events contain changes to profiles for example, the slide in workbook will also display the change details, comparing old against new values;

Workbook Source & Installation
The JSON source code for the main Intune Audit is available on our GitHub repo. During installation of the workbook, you will need to update elements within the JSON, or via the UI editor to display your information.
Intune Audit Dashboard – Main JSON – Reporting/IntuneAuditDashboard.json at main · MSEndpointMgr/Reporting (github.com)
- At lines 781 and 1801 where you see “%YourDomainHere%” replace that with your domain, i.e. MSEndpointMgr.
- At line 174 replace “%YourLogAnalyticsWorkspaceHere%” with the name of your Log Analytics workspace
- At line 7 replace the “%YourURLHere%” with the URL of your company logo
Intune Audit Details Dashboard – Details JSON – Reporting/IntuneAuditEventDetails.json at main · MSEndpointMgr/Reporting (github.com)
For the details slide in workbook to function, you must specify the name of the workbook in the parameters of the main workbook, to do so follow the bellow instructions;
- Edit the Intune Audit Dashboard
- Click on Edit in the Parameters section at the top of the workbook;
- Select the DetailsWorkbook parameter and hit the edit button
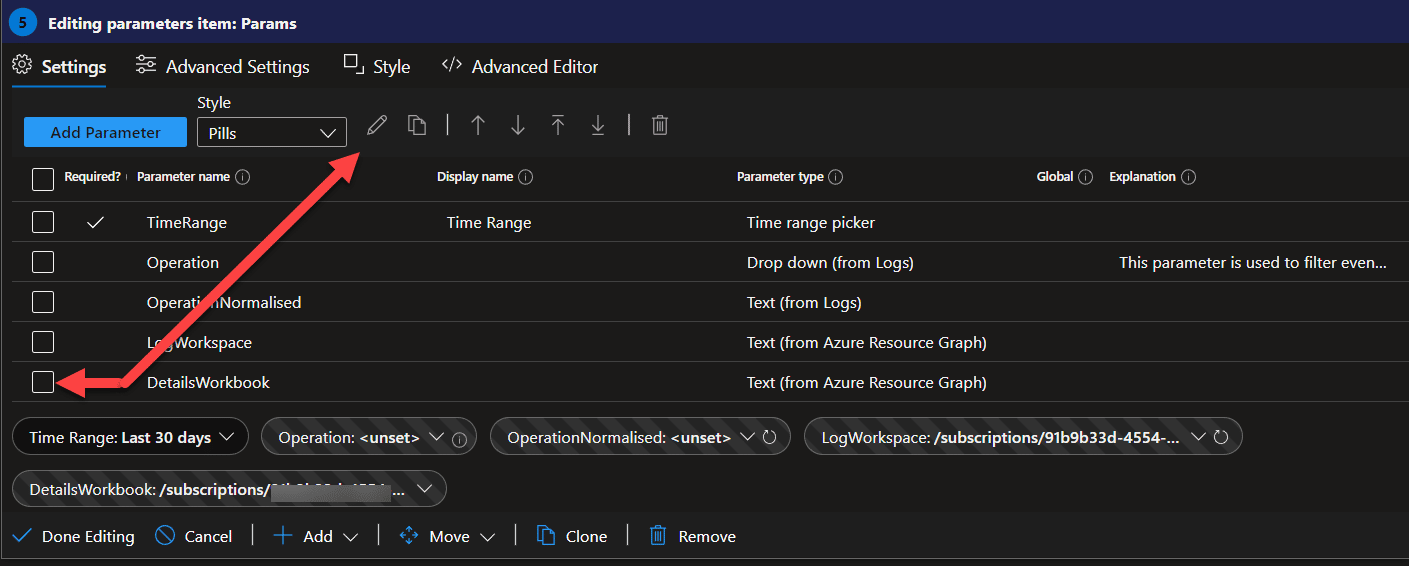
- Edit the displayName value to be the same as the Details workbook you imported and saved, then hit Run Query
- You should now have a single value in the path
- Click on “Save” in the parameters and then save the workbook
Conclusion
Through the use of Log Analytics and KQL, auditing doesn’t have to be a pain anymore, and if you have any suggestions on how we could extend this workbook, please let us know!
Please note that we will also be creating a solutions page soon with links to all of our KQL workbooks! Keep a lookout in the solutions section of the site.


Hi all
i upload edited IntuneAuditDashboard.json to intune dashboard but its empty.
Amazing work!
I think I might have figured out how to add Workbooks, but the specific instructions in this post are not clear what needs to be done for this to work It seems like there are two workbooks that need to be created but verbiage and screenshots do not seem to elaborate specifically on how to accomplish this.
Please advise.
For people who are not as knowledgeable about how to set up workbooks, can you provide some instructions here?
Thank you,
Niles
I’ve updated the domain sections to:
“thresholdValue”: “domian.”,
…!has \”domain.\”\r\n| extend…
And the behaviour is the same…
Hello, I have configured the json file as per your instructions, however when I try to upload it as a new dashboard, nothing appears – just a blank area where the dashboard should be.
Just to confirm, where I entered my domain it looks like:
“thresholdValue”: “mydomain.com.”,
…!has \”domain.com.\”\r\n| extend…
^^ Is the correct way to enter the domain? Or is there anything I have missed?
Please let me know.
Thanks,
John
is there a step by step how to implement? I need a full set of instructions as I can’t create the same dashboard as in the pictures.
Would it be possible for you to enhance the workbook by adding ‘Add User’, ‘Disable Account’, and also ‘Delete User’ in the Operation Type filters? I LOVE the visibility this Workbook provides in terms of device/application audit but I feel it completely lacks end user auditing and this would make the workbook extremely useful to my org.
A couple of items of feedback–maybe I’m doing something wrong?
1. In the Target Actions, I’ve only got one event showing when it’s “unset”
UpdateDeviceProperties WindowsAutopilotDeviceIdentity
Is this expected to only have this action when it’s “unset” instead of listing all actions?
2. Admin actions tab is not picking up any user ids and therefore no data.
3. I don’t get the slide in workbook for the details when clicking on one of them in Target Actions. I can’t test the Admin actions because I’m not getting any data in there.
The details workbook is copied from raw data from your github repo, and then display name is copied into the edited parameter of the dashboard workbook. I’m getting the single value in the path as expected. Not sure what I’m doing wrong?
Hi,
Is it possible to configure Audit for below events on the Intune Managed device (Windows 10 / 11 device) :
1. Local User login and Logoff.
2. Local Admin Login and LogOff.
3. MS update installed or removed.
4. Application installed or Uninstalled.
5. Start and stop of any service.
6. Start of any Process using Admin Credential (Domain & Local).
7. Device shutdown.
If yes, then where can I locate audited Event ID, Name, Description, will they be stored within Intune console or on the Client Machine (Windows 10 / 11 device).
Regards,
Vishal