In this post I am going to revisit, clarify, and provide updated troubleshooting guidance in respect to something that is absolutely vital to prevent network bandwidth issues, that of course is Delivery Optimization.
Background
In my day to day job I have seen huge variations of DO caching figures caused by that thing that we always point the finger of blame at, but often have to provide mountains of proof about, yes, I am of course talking about “the network”, oh, and DNS also features, surprise, surprise.
Recently I presented a session at MMSMOA around the importance of allowing access to Microsoft service URL’s and IP’s, and as part of that I had some quick shocking results caused by misconfiguration, so I thought it was high time to provide a follow up on my previous post from 2022 on this subject (Delivery Optimization Configuration & Monitoring – MSEndpointMgr).
During deliberate traffic rule blocks for the session, I selectively blocking URL’s associated with DO traffic, something that your typical network / firewall admin will do for you, often without you knowing. With the element of the “managed” network dialed in, I was able to send my clients around the DO bend when it came to downloading content, in fact having some initial values of 110-200%, and now giving 110% is not better when it comes to DO, I was then able to record some of my client devices achieving astronomical figures;
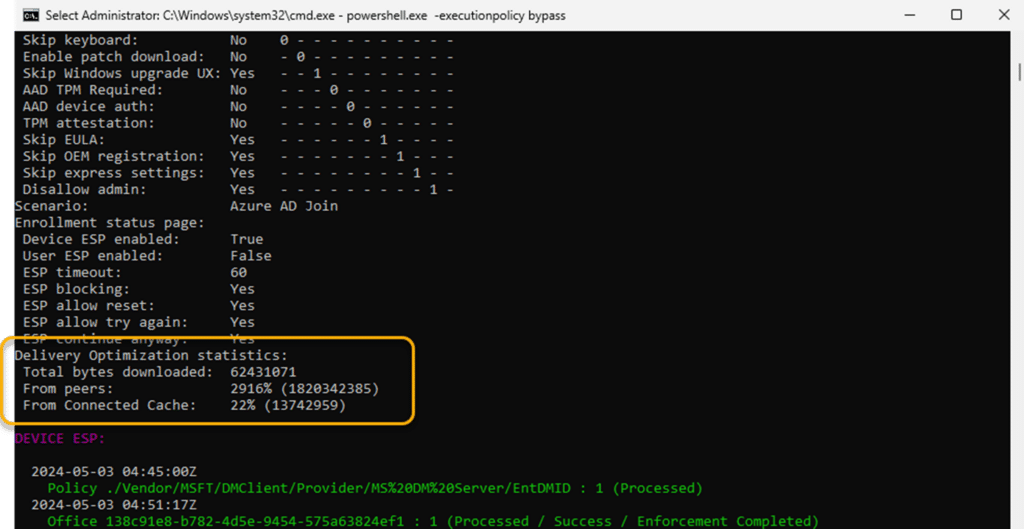
Yes indeed you are reading that correct, the stats show 2916% of traffic from peers, or to say it another way, the client reported it required 62MB of downloaded DO traffic, but downloaded 1.8GB. Now imagine if this is happening in your network, and you can see where the finger of blame might be pointed when “things go bump” on the network.
Aside from the deliberate example above, around the same time I also had calls from customers which had no issues with their delivery optimization configuration up until they all of a sudden got calls from their network team.
Therefore the purpose of this updated post is to help others achieve more with DO, understand the different types of content, unique OS differences, and tools available to you to troubleshoot, and be confident in what you are deploying.
Connectivity Requirements
Before we look into the differences between the OS builds, the commands and scripts that are useful, and how we can troubleshoot, we need to understand one clear thing. Clients need connectivity to the Microsoft Delivery Optimization service, I know this might be obvious to you, but your network admin might have a difference of opinion initially.
Clients in this respect need to reach the endpoint URLs and IP’s associated with DO / Connected Cache, and it is vital that your network admin understands that the clients will need unauthenticated in some cases and go direct without your proxy getting in the way.
The full list of these URL’s and IP’s is provided in the Microsoft Learn docs – Microsoft Connected Cache content and services endpoints – Windows Deployment | Microsoft Learn
Reducing Connectivity Requirements
Usually the next question from the network admin will be how much traffic, how often, and
what can you do to reduce this. Well this is where peering configuration is important, and
where possible, leverage existing infrastructure to serve your clients.
Peering probably isn’t a new concept to many of you, perhaps having played around with peer
cache in Configuration Manager. With DO, clients can peer with each other, using TCP port
7680 in most normal cases, and thus this port must remain open / available on your clients.
For those networks that have multiple outbound NAT’s available to clients on the same
network, you will also need to open up TCP/UDP 3544, more information on this is available
here – Delivery Optimization Frequently Asked Questions – Windows Deployment | Microsoft Learn
Should you have Configuration Manager in play, you can also leverage your pre-existing
Distribution Points, by adding the Connected Cache option on your DP configuration;
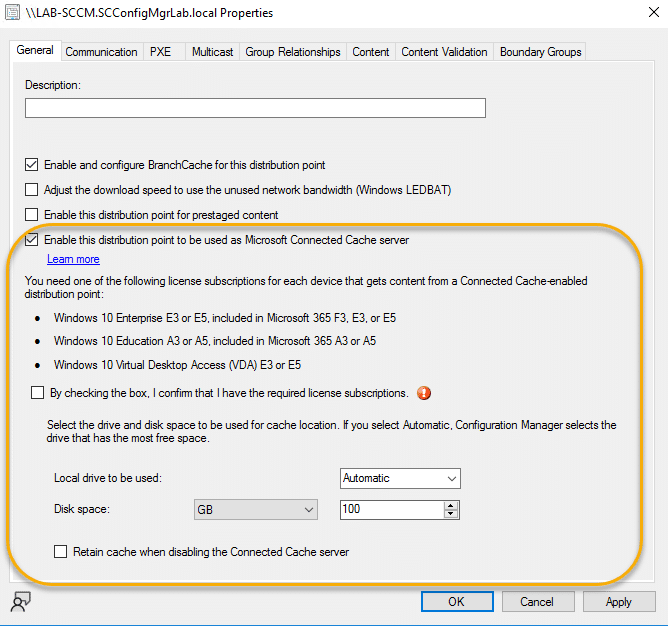
Configuring local cache servers provides you with a very optimal way of seeding your
internal clients, although you also need to consider which MCC servers are available to
which clients in your DO configuration;

The reason this is so important of course, is to help control the network traffic across your
LAN/WAN, and ensure that clients in the US for instance, are not talking to DO cache servers in
Australia, and vice versa, with the same of course applying to the client peers.
Should you wish to get a deeper overview of Connected Cache, Microsoft provide good
guidance here – Microsoft Connected Cache – Configuration Manager | Microsoft Learn
Configuration Differences – Windows 10 vs 11
First of all we need to understand that although Windows 10 and 11 are quite similar, the policies that control applying the settings from Intune (CSP backed MDM policies) can be selective in the version of Windows they work with.
One such setting is the “DO Restrict Peer Selection By” which as you can see from the below screenshot, should work with Windows 10 2004 and higher;
Source – DeliveryOptimization Policy CSP – Windows Client Management | Microsoft Learn
The issue is that the CSP setting only works to set the DNS-SD option with Windows 11. This is important as the DNS-SD option is used to allow local peer discovery, removing the clients need to contact the backend Microsoft Delivery Optimization service in order to be informed about the peers which have content.
That however is only the first part of the benefit of this setting, as it then also has a nice value added feature in terms of how content is shared. By default clients will only provide up to four seedling slots (for content sharing) any one particular time, however, with DNS-SD enabled, this restriction is removed, so the is no seeding slot limits imposed and this can help you achieve much higher DO figures.
This process is visualized in the following diagrams.
Standard subnet mask peer discovery & sharing
DNS-SD peer discovery & sharing
As you can see in the above DNS-SD diagram, peer distribution is increased, and actual overall traffic communications are reduced to the Microsoft Delivery Optimization backend service. To enable this feature on your Windows 10 clients then, you could create a PowerShell script and target the supported releases, below is an example of how to script this;
#region Variables

# Set the registry key path
$RegPath = "HKLM:\SOFTWARE\Policies\Microsoft\Windows\DeliveryOptimization"
$RegEntry = "DORestrictPeerSelectionBy"
$RegValue = 2
$RegEntryType = "DWORD"

#endregion Variables

# region Code

# Check for supported operating system
if ((Get-CimInstance -ClassName Win32_OperatingSystem).Version -lt '10.0.19041') {
    Write-Output "This script is only supported on Windows 10 version 19041 or later, or Windows 11. Exiting script."; exit 1
}else{
    Write-Output "Operating system is supported. Continuing with script."

    # Create registry value entry
    try {

        if ((Get-Item -Path $RegPath -ErrorAction SilentlyContinue | Get-ItemProperty -Name $RegEntry -ErrorAction SilentlyContinue | Select-Object -ExpandProperty $RegEntry) -ne $RegValue){

            # Create registry value entry to enable Delivery Optimization Peer Selection (DNS-SD)
            Write-Output "Creating registry value entry for Delivery Optimization Peer Selection (DNS-SD)"
            New-Item -Path $RegPath -Force | Out-Null
            New-ItemProperty -Path $RegPath -Name $RegEntry -Value $RegValue -PropertyType $RegEntryType -Force | Out-Null

            # Script ran successfully
            Write-Output "Script ran successfully. Delivery Optimization Peer Selection will now use DNS-SD to discover peers."

            # Restart the Delivery Optimization service
            Write-Output "Restarting the Delivery Optimization service"
            Restart-Service -Name dosvc -Force -Verbose

            # Exit script
            exit 0

        }elseif ((Get-Item -Path $RegPath  | Get-ItemProperty -Name $RegEntry | Select-Object -ExpandProperty $RegEntry) -eq $RegValue) {

            # Value already set
            Write-Output "Script value already set. Delivery Optimization Peer Selection is configured to use DNS-SD to discover peers."; exit 0
        }
    } catch {

        # OUtput error message
        Write-Error "Failed to create registry entry for Delivery Optimizatio Peer Selection. Full error details: $($_.Exception.Message)"; exit 1
    }
}

# endregion Code
Delivery Optimization Efficiency Nose Dive
As stated, back in March I noted a severe drop off in DO efficiency off the back of a chance coincidental call with a customer who reported network bandwidth issues. This was something that had happened before when they had switched over firewall provider, so the usual course of ensuring the finger of blame landed on the right element was.
Looking into the DO statistics, I initially suspected missing firewall / proxy bypass rules, as the required endpoints change over time and of course not everyone keeps these up to date. In this instance there were additional URL’s that had not been committed, so I would as always urge you to keep an eye out for changes in the documentation (Microsoft Connected Cache content and services endpoints – Windows Deployment | Microsoft Learn).
With Windows Update for Business reports already configured, and UC logs being thus available in Log Analytics, it provides an excellent starting place to evaluate traffic source patterns over time. Running the below query, you can see this visual decline using a time chart render;
UCDOAggregatedStatus
| summarize BytesFromPeersPer = (sum(0.0 + BytesFromPeers + BytesFromGroupPeers)/ sum(BytesFromPeers + BytesFromGroupPeers + BytesFromCache+BytesFromCDN)) * 100.0 , BytesFromCDNPer = (sum(0.0 + BytesFromCDN)/ sum(BytesFromPeers + BytesFromGroupPeers + BytesFromCache+BytesFromCDN)) * 100.0 ,  BytesFromCachePer = (sum(0.0 + BytesFromCache)/ sum(BytesFromPeers + BytesFromGroupPeers + BytesFromCache+BytesFromCDN)) * 100.0 by TimeGenerated
| project BytesFromSources = pack("BytesFromCDN" , BytesFromCDNPer , "BytesFromPeers" , BytesFromPeersPer , "BytesFromCache" , BytesFromCachePer ), TimeGenerated | mv-expand BytesFromSources
| extend BytesPercentageType = tostring(bag_keys(BytesFromSources)[0] )
| extend BytesPercentage = todouble(BytesFromSources[BytesPercentageType])
| project BytesPercentageType , BytesPercentage, TimeGenerated | render timechart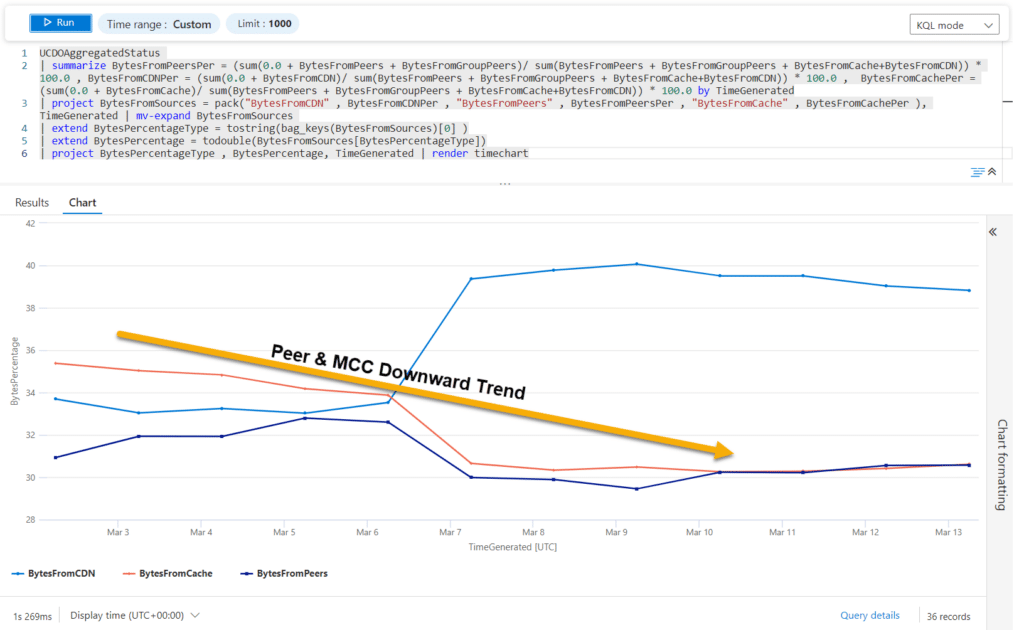
The average peer distribution across all categories was circa 70-80%, and now we were seeing this dropping to a low of 50%. This led me to re-evaluate the entire DO configuration, to ensure that someone had unintentionally caused the issue.
As an additional measure to ensure that the statistics I was observing were accurate, I created a Delivery Optimization log collection script, and added this in as a remediation. This allowed me to send the performance logs and configuration values through to Log Analytics so I could report and compare these, removing the requirement to rely on the UCDO logs.
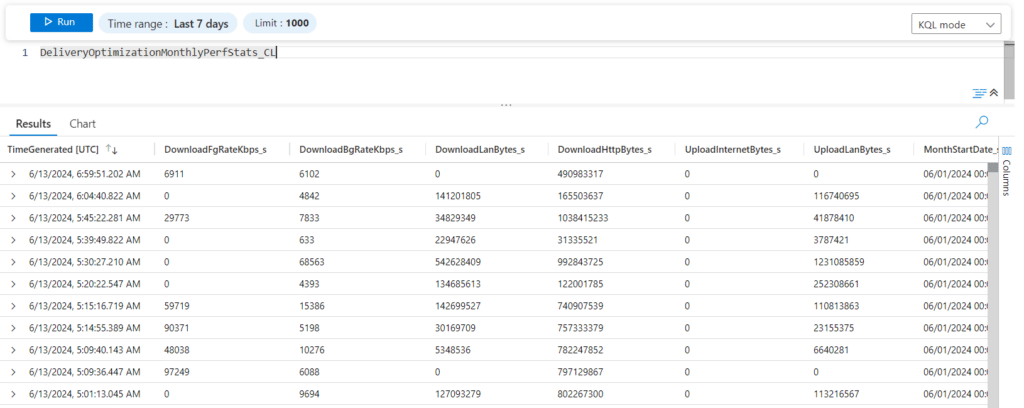
Whereas the values were not identical, there was not enough of a gap to raise concern here.
Troubleshooting – PowerShell Cmdlets & Scripts
As with any issue, understanding how to troubleshoot the issue at hand is vital. This is where some of the Microsoft documentation is a bit sparse, or at least it appears to be without digging into some less well known scripts they provide.
Let us start with the PowerShell cmdlets;
Get-DeliveryOptimizationLog
This first one that provides valuable information on what is going on with your clients, In its default instance, it provides information on each of your DO jobs running, below is an example;

Although the cmdlet can of course be used within the interactive PowerShell session, for improved visibility you can output the entire stream to a log file, by running something similar to the below;
Get-DeliveryOptimizationLog | Set-Content -Path DeliveryOptimization.log
When reviewing the output, look out for each DO content download section beginning with “DownloadStart” and finishing with “DownloadCompleted;
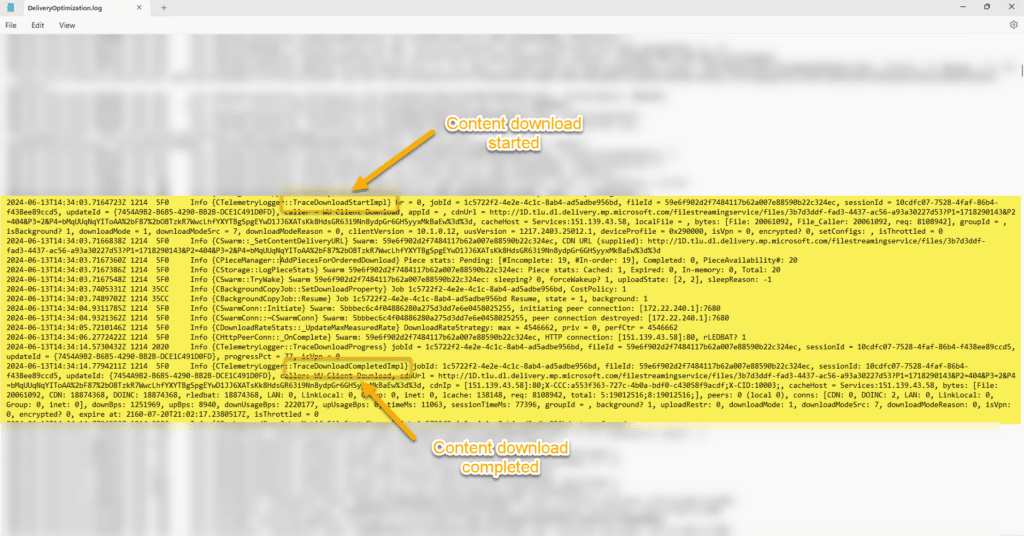
In the above example, the content is sourced from a connected cache server, and details of the number of peers, files etc are all presented.
Should the log not provide sufficient troubleshooting information however, there is an option to enable verbose logging by running the following cmdlet;
Enable-DeliveryOptimizationVerboseLogs
In the background the logs are written to the “C:\Windows\ServiceProfiles\NetworkService\AppData\Local\Microsoft\Windows\DeliveryOptimization\Logs” folder, where you will see database files (.etl) such as in the below screenshot;
DeliveryOptimizationTroubleshooter Script
One of the less well known troubleshooting scripts for DO is available from the PowerShell gallery, the DeliveryOptimizationTroubleshooter (PowerShell Gallery | DeliveryOptimizationTroubleshooter 1.0.0), and it does exactly what it says;
A very useful element of this script is for error code matching, something that remains largely undocumented by Microsoft.
Below is a more user friendly extract of the JSON formatted error list;
| Error Code | Description |
|---|---|
| 0x80D01001 | Delivery Optimization was unable to provide the service. |
| 0x80D02002 | Download of a file saw no progress within the defined period. |
| 0x80D02003 | Job was not found. |
| 0x80D02004 | There were no files in the job. |
| 0x80D02005 | No downloads currently exist. |
| 0x80D0200B | Memory stream transfer is not supported. |
| 0x80D0200C | Job has neither completed nor has it been cancelled prior to reaching the max age threshold. |
| 0x80D0200D | There is no local file path specified for this download. |
| 0x80D02010 | No file is available because no URL generated an error. |
| 0x80D02011 | SetProperty() or GetProperty() called with an unknown property ID. |
| 0x80D02012 | Unable to call SetProperty() on a read-only property. |
| 0x80D02013 | The requested action is not allowed in the current job state. |
| 0x80D02015 | Unable to call GetProperty() on a write-only property. |
| 0x80D02016 | Download job is marked as requiring integrity checking but integrity checking info was not specified. |
| 0x80D02017 | Download job is marked as requiring integrity checking but integrity checking info could not be retrieved. |
| 0x80D02018 | Unable to start a download because no download sink (either local file or stream interface) was specified. |
| 0x80D02019 | An attempt to set a download sink failed because another type of sink is already set. |
| 0x80D0201A | Unable to determine file size from HTTP 200 status code. |
| 0x80D0201B | Decryption key was provided but file on CDN does not appear to be encrypted. |
| 0x80D0201C | Unable to determine file size from HTTP 206 status code. |
| 0x80D0201D | Unable to determine file size from an unexpected HTTP 2xx status code. |
| 0x80D0201E | User consent to access the network is required to proceed. |
| 0x80D02200 | The download was started without providing a URI. |
| 0x80D02201 | The download was started without providing a content ID. |
| 0x80D02202 | The specified content ID is invalid. |
| 0x80D02203 | Ranges are unexpected for the current download. |
| 0x80D02204 | Ranges are expected for the current download. |
| 0x80D03001 | Download job not allowed due to participation throttling. |
| 0x80D03002 | Download job not allowed due to user/admin settings. |
| 0x80D03801 | DO core paused the job due to cost policy restrictions. |
| 0x80D03802 | DO job download mode restricted by content policy. |
| 0x80D03803 | DO core paused the job due to detection of cellular network and policy restrictions. |
| 0x80D03804 | DO core paused the job due to detection of power state change into non-AC mode. |
| 0x80D03805 | DO core paused the job due to loss of network connectivity. |
| 0x80D03806 | DO job download mode restricted by policy. |
| 0x80D03807 | DO core paused the completed job due to detection of VPN network. |
| 0x80D03808 | DO core paused the completed job due to detection of critical memory usage on the system. |
| 0x80D03809 | DO job download mode restricted due to absence of the cache folder. |
| 0x80D0380A | Unable to contact one or more DO cloud services. |
| 0x80D0380B | DO job download mode restricted for unregistered caller. |
| 0x80D0380C | DO job is using the simple ranges download in simple mode. |
| 0x80D0380D | DO job paused due to unexpected HTTP response codes (e.g. 204). |
| 0x80D05001 | HTTP server returned a response with data size not equal to what was requested. |
| 0x80D05002 | The Http server certificate validation has failed. |
| 0x80D05010 | The specified byte range is invalid. |
| 0x80D05011 | The server does not support the necessary HTTP protocol. Delivery Optimization (DO) requires that the ser… |
| 0x80D05012 | The list of byte ranges contains some overlapping ranges, which are not supported. |
| 0x80D06800 | Too many bad pieces found during upload. |
| 0x80D06802 | Fatal error encountered in core. |
| 0x80D06803 | Services response was an empty JSON content. |
| 0x80D06804 | Received bad or incomplete data for a content piece. |
| 0x80D06805 | Content piece hash check failed. |
| 0x80D06806 | Content piece hash check failed but source is not banned yet. |
| 0x80D06807 | The piece was rejected because it already exists in the cache. |
| 0x80D06808 | The piece requested is no longer available in the cache. |
| 0x80D06809 | Invalid metainfo content. |
| 0x80D0680A | Invalid metainfo version. |
| 0x80D0680B | The swarm isn’t running. |
| 0x80D0680C | The peer was not recognized by the connection manager. |
| 0x80D0680D | The peer is banned. |
| 0x80D0680E | The client is trying to connect to itself. |
| 0x80D0680F | The socket or peer is already connected. |
| 0x80D06810 | The maximum number of connections has been reached. |
| 0x80D06811 | The connection was lost. |
| 0x80D06812 | The swarm ID is not recognized. |
| 0x80D06813 | The handshake length is invalid. |
| 0x80D06814 | The socket has been closed. |
| 0x80D06815 | The message is too long. |
| 0x80D06816 | The message is invalid. |
| 0x80D06817 | The peer is an upload. |
| 0x80D06818 | Cannot pin a swarm because it’s not in peering mode. |
| 0x80D06819 | Cannot delete a pinned swarm without using the ‘force’ flag. |
So now we understand the tools to use, and the associated error codes, its time to understand why DO stats simply fell off a cliff edge…
Teams Traffic – Now Included!
Following a call with the Microsoft product team responsible for Delivery Optimization, the underlying issue was highlighted, and something that caught us by surprise. Starting in March of this year, and the rollout of the “New Teams” client, updates for the client are using Delivery Optimization.
On the face of it this sounds like a good thing, however, there is one big difference with the content, as the content in question is non-peerable. Yes, it was the new Teams client and associated updates in this instance causing the large drop in efficiency. The Teams updates in question are bundled as part of the “other” category, you can see this reflected in the updated DO traffic table in the Microsoft docs (What is Delivery Optimization? – Windows Deployment | Microsoft Learn).
Below you can see which items are covered by the “other” category;
You can see the Teams entries for yourself by running the following cmdlet from PowerShell;
Get-DeliveryOptimizationLog | Where-Object {$_.Message -match "Teams"}Resulting in something like the following screen;
As the content is not cached, this results in the DO stats falling off a cliff edge of course! This is something that obviously looks bad in your reports, and has an impact on the network, so I am both curious to see what updates come along for Teams, and also if the “Other” category will be split out into something more meaningful.
🪲Bugs!
During the process of creating this post I also discovered a couple of bugs that have been confirmed by the Microsoft product team, and they are actively working to resolve these.
Delivery Optimization Group ID
The first bug is related to the use of group ID’s in your delivery optimization configuration.
If for example you define the DODownloadMode as value 2 (When this option is selected, peering will cross NATs. To create a custom group use Group ID in combination with Mode 2), and you are using DHCP scope option 234 to assign group ID’s, you might find the application event log repeatedly showing the following warnings;
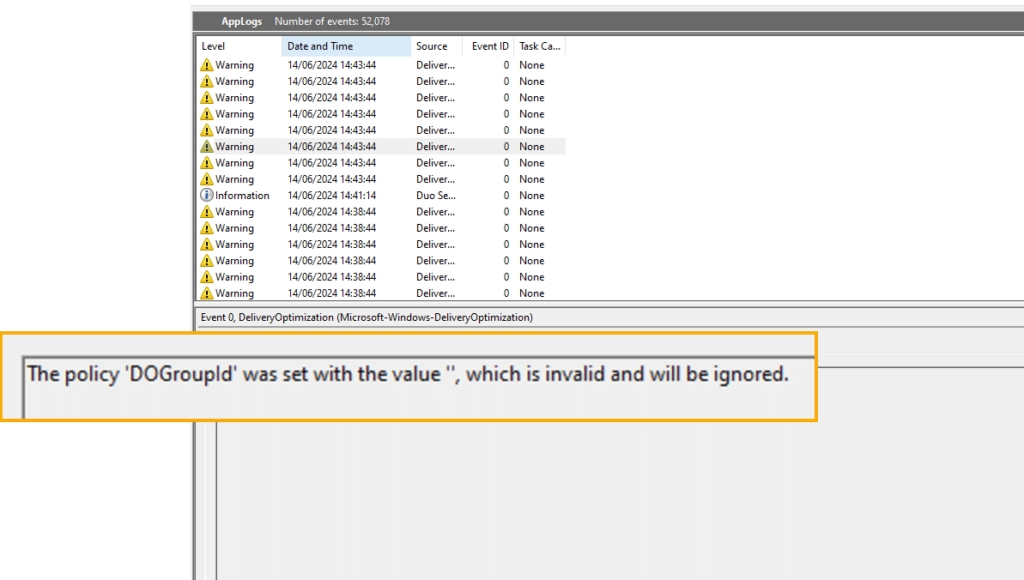
Reading the documentation it does not state that you need to create a group ID with the DO mode set in this instance. Of course if you were not assigning a group ID by DHCP, you would need to specify this value, and that would be assigned to your clients like in the below screenshot;
[Windows.Management.Policies.NamedPolicy,Windows.Management.Policies,ContentType=WindowsRuntime]
([Windows.Management.Policies.NamedPolicy]::GetPolicyFromPath("DeliveryOptimization", "DOGroupId")).GetString() 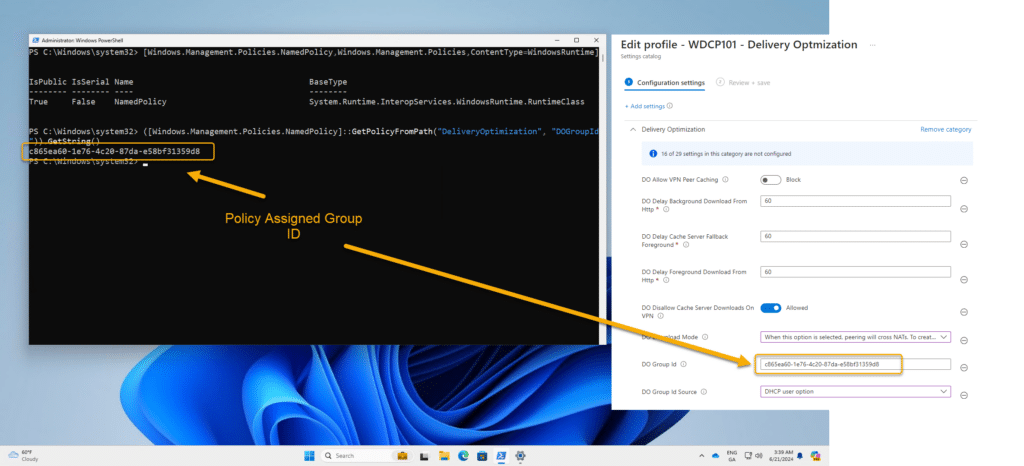
But where you are assigning the group ID via DHCP, why would you need to specify a group ID within your policy? Furthermore how can we confirm the group ID is being picked up by the client?
Well this is where an excellent little utility written by Oliver Kieselbach comes into play, that being the DHCPOption.exe.
GitHub here – Intune/ManagementExtension-Samples/DOScript at master · okieselbach/Intune · GitHub
Write up here – Use Delivery Optimization with DHCP Option on Pre-Windows 10 version 1803 – Modern IT – Cloud – Workplace (oliverkieselbach.com))
Running the utility and specifying the DHCP option, you can then confirm that the values being received are those expected;
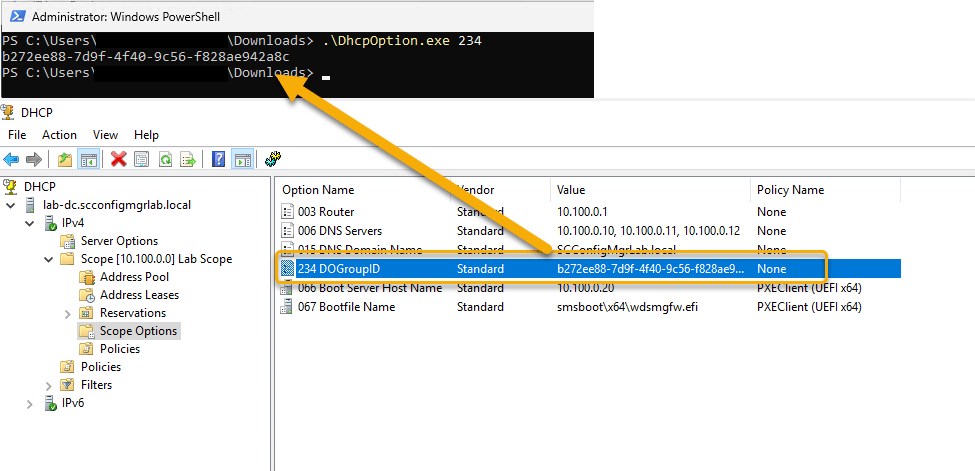
In the above example then we see we have a GUID being provided by 234 with no issue, interestingly though if you were to check WMI for the group ID at this stage, you would receive a null value;

By implementing an arbitrary group ID in your configuration however, this resolves the issue, while it appears that the group ID obtained by DHCP is adhered to. You can check the number of devices assigned to your group ID’s if you have Windows Update for Business reports enabled, by checking the UCDOStatus logs, below is an example;
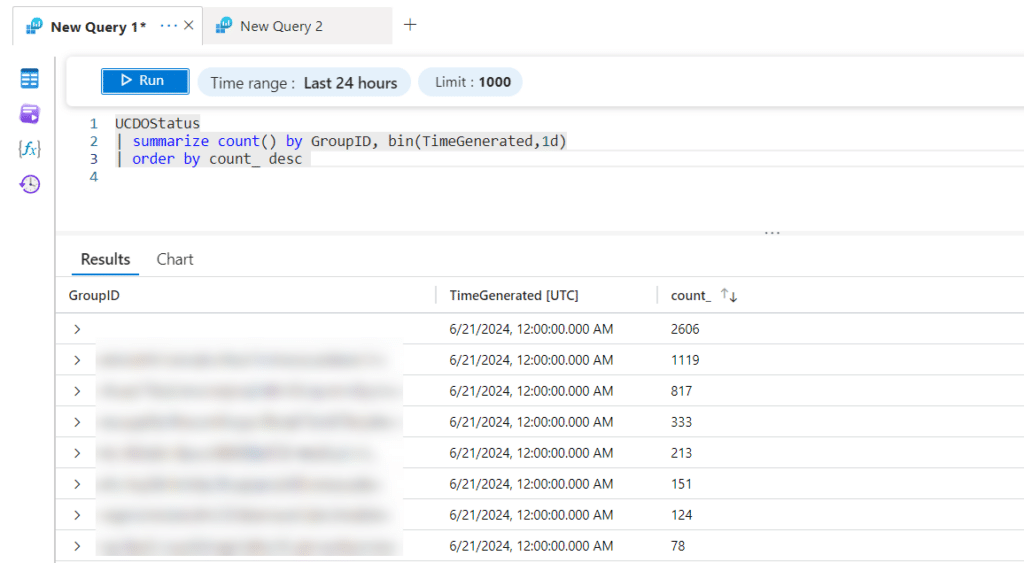
Note that the GroupID values are not listed in the same GUID format though.
Should you want to track this as a trend, to ensure that clients are picking up new group ID values, you can change the query to render a time chart;
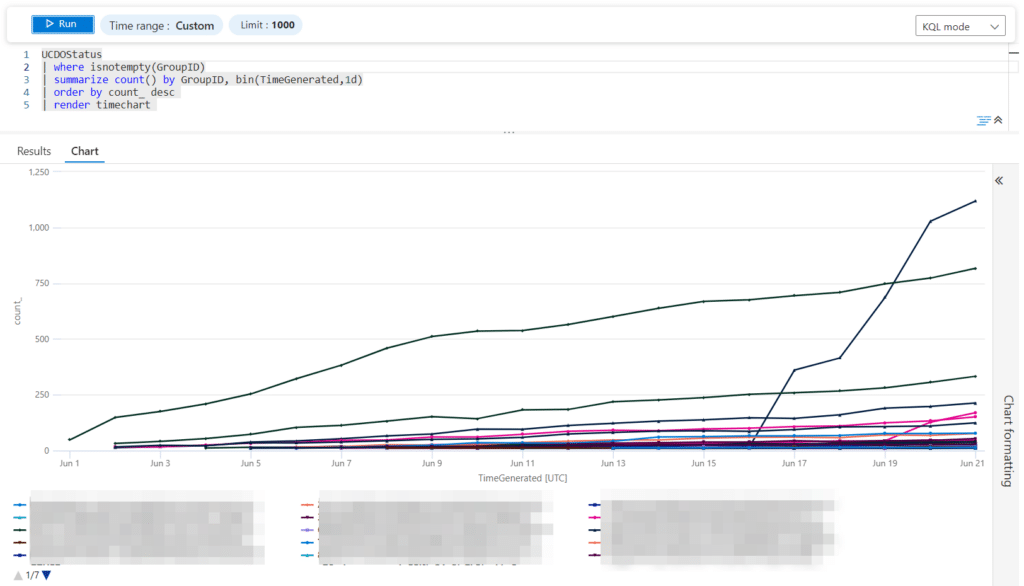
Blank Group ID – UCDOStatus Log
The second bug is related to device group ID membership within the UCDOStatus log, whereby you see a lot of devices which have verified group ID’s (locally) showing as having no group ID;
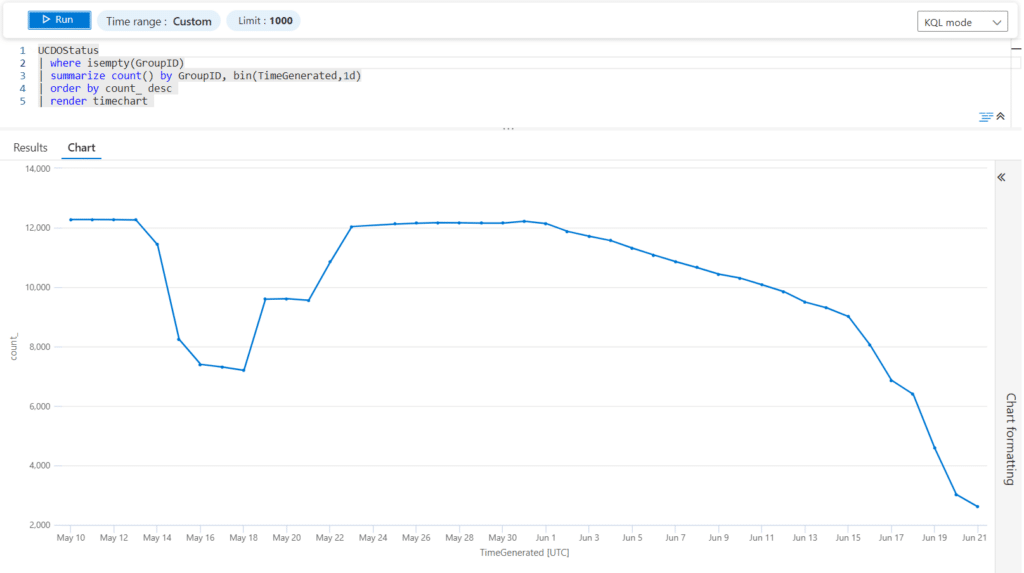
The Microsoft product team responsible for DO are currently working on a fix for these issues at present.
Reporting – Updated KQL Workbook
Thanks to James Robinson, my previous Delivery Optimization workbook had been updated to leverage the newer logs, so I used that as a foundation to further update the workbook.
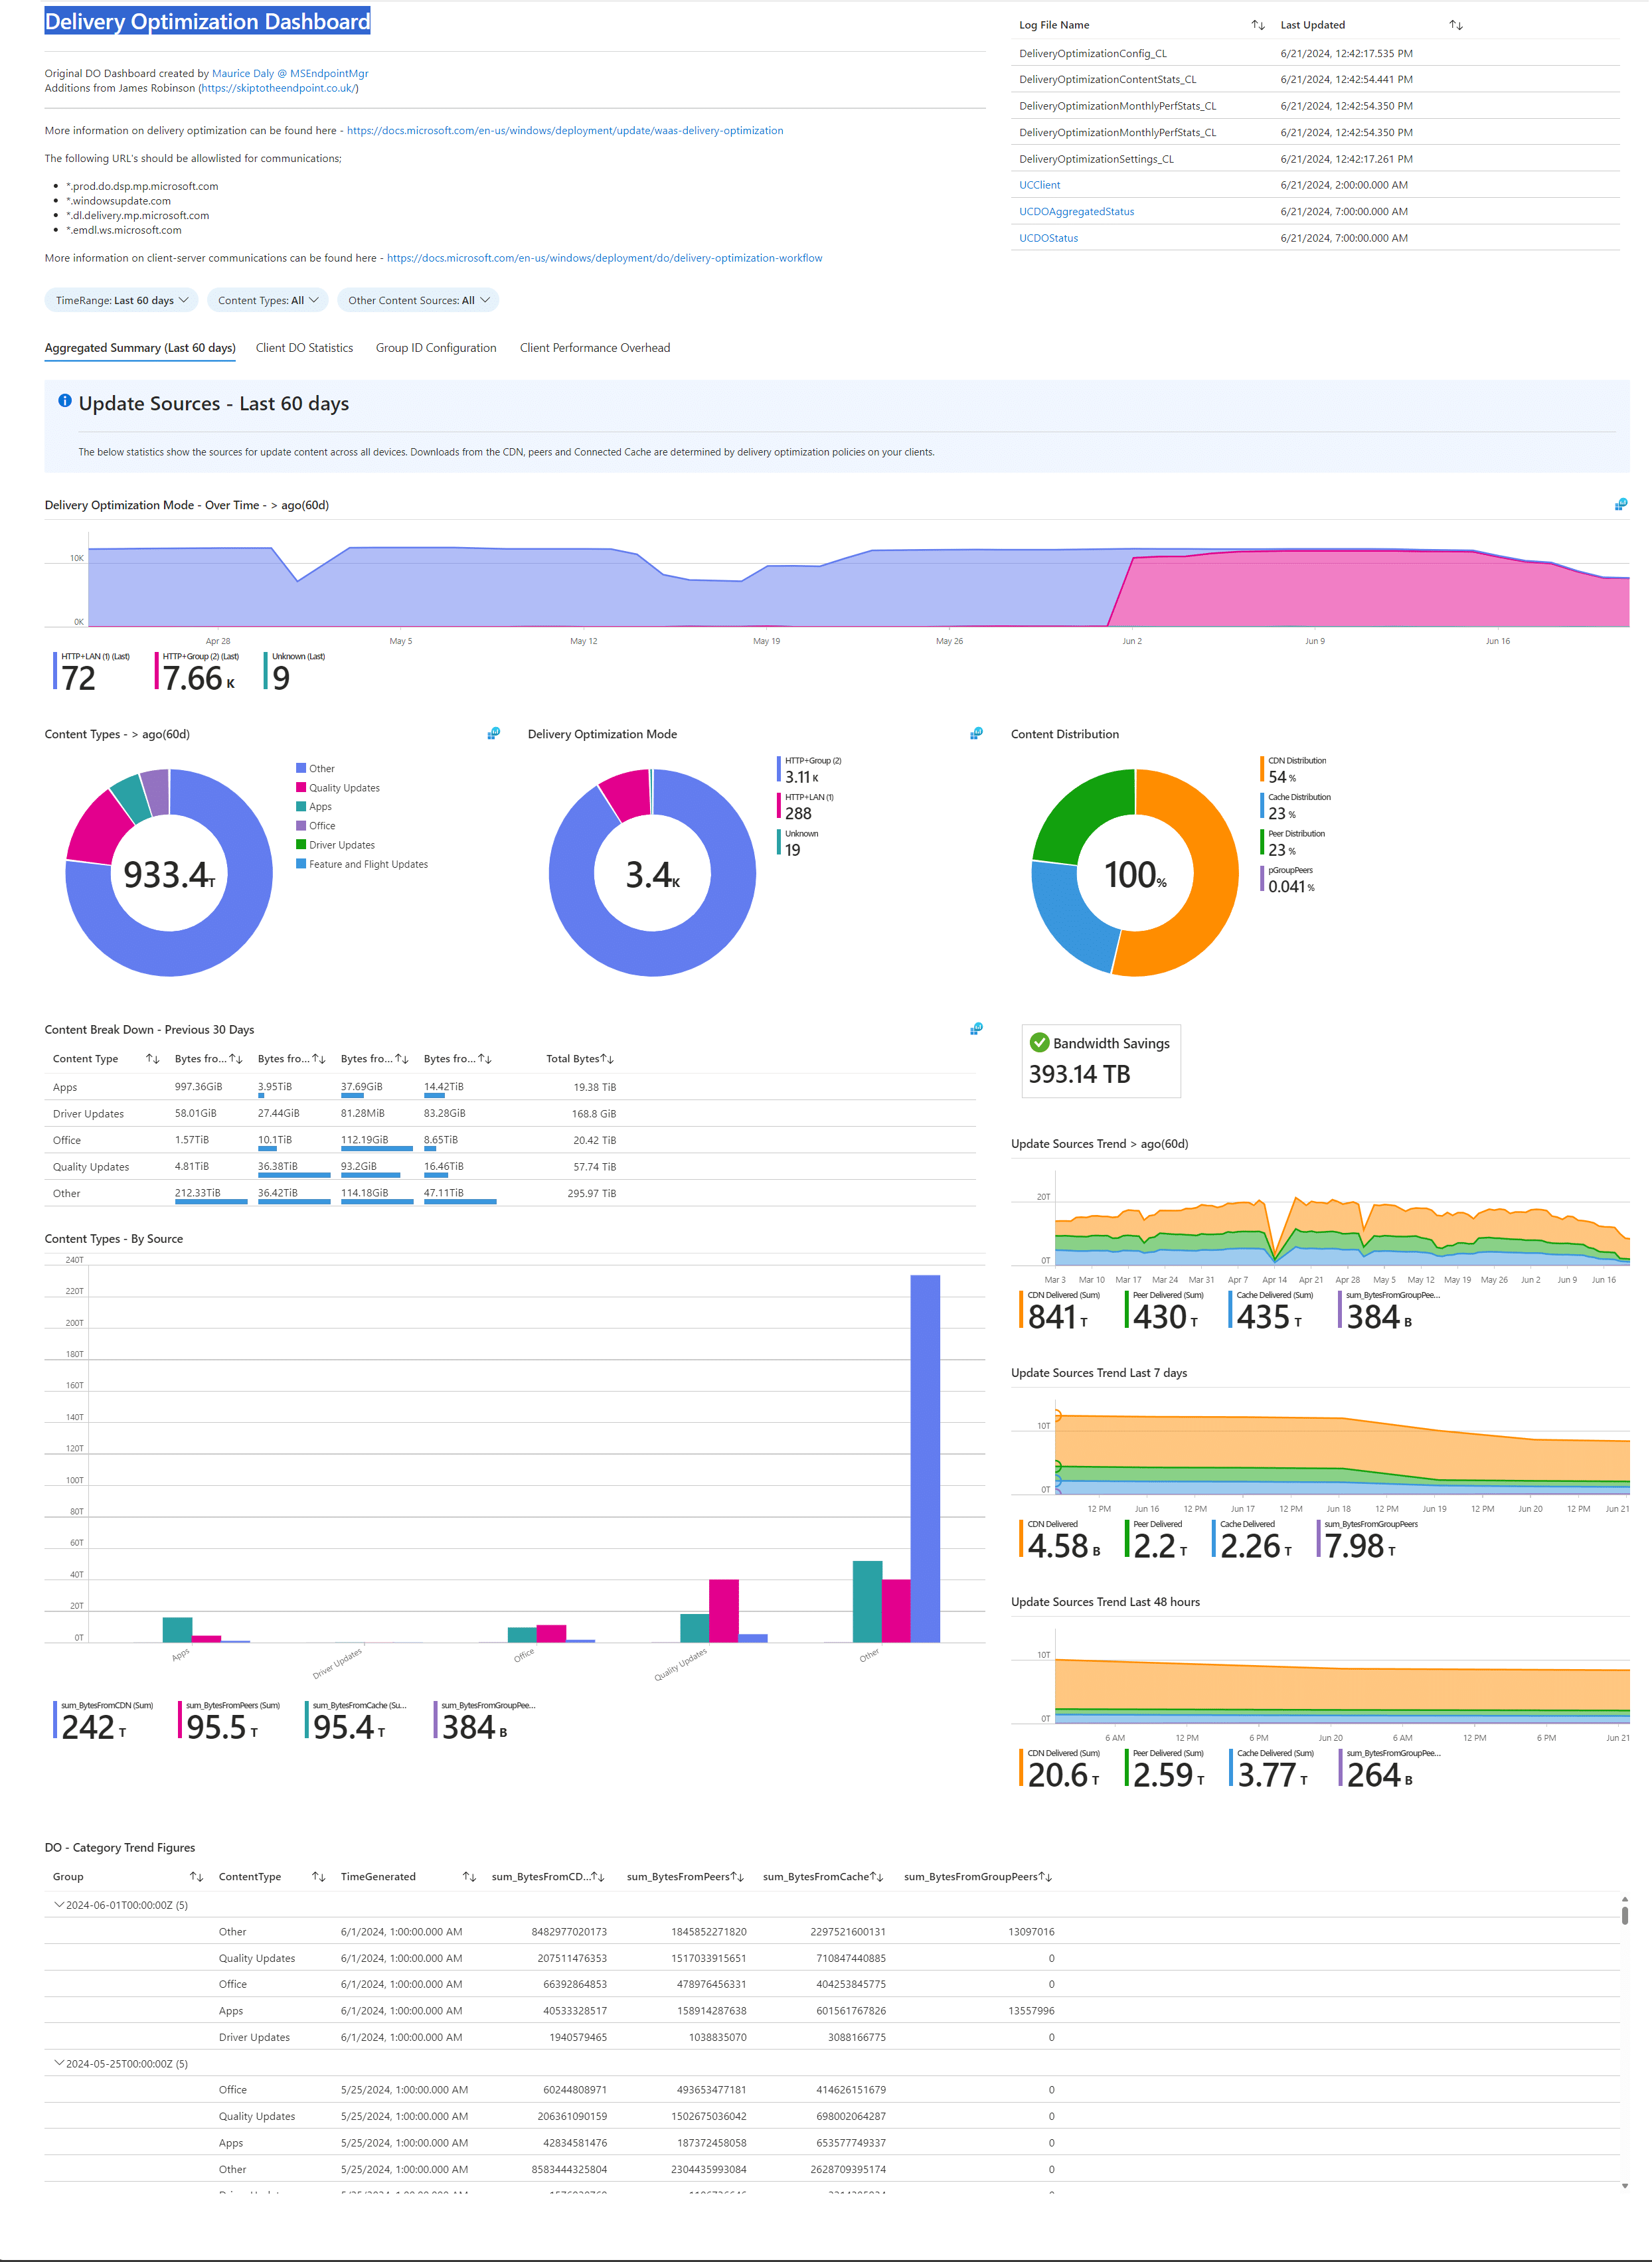
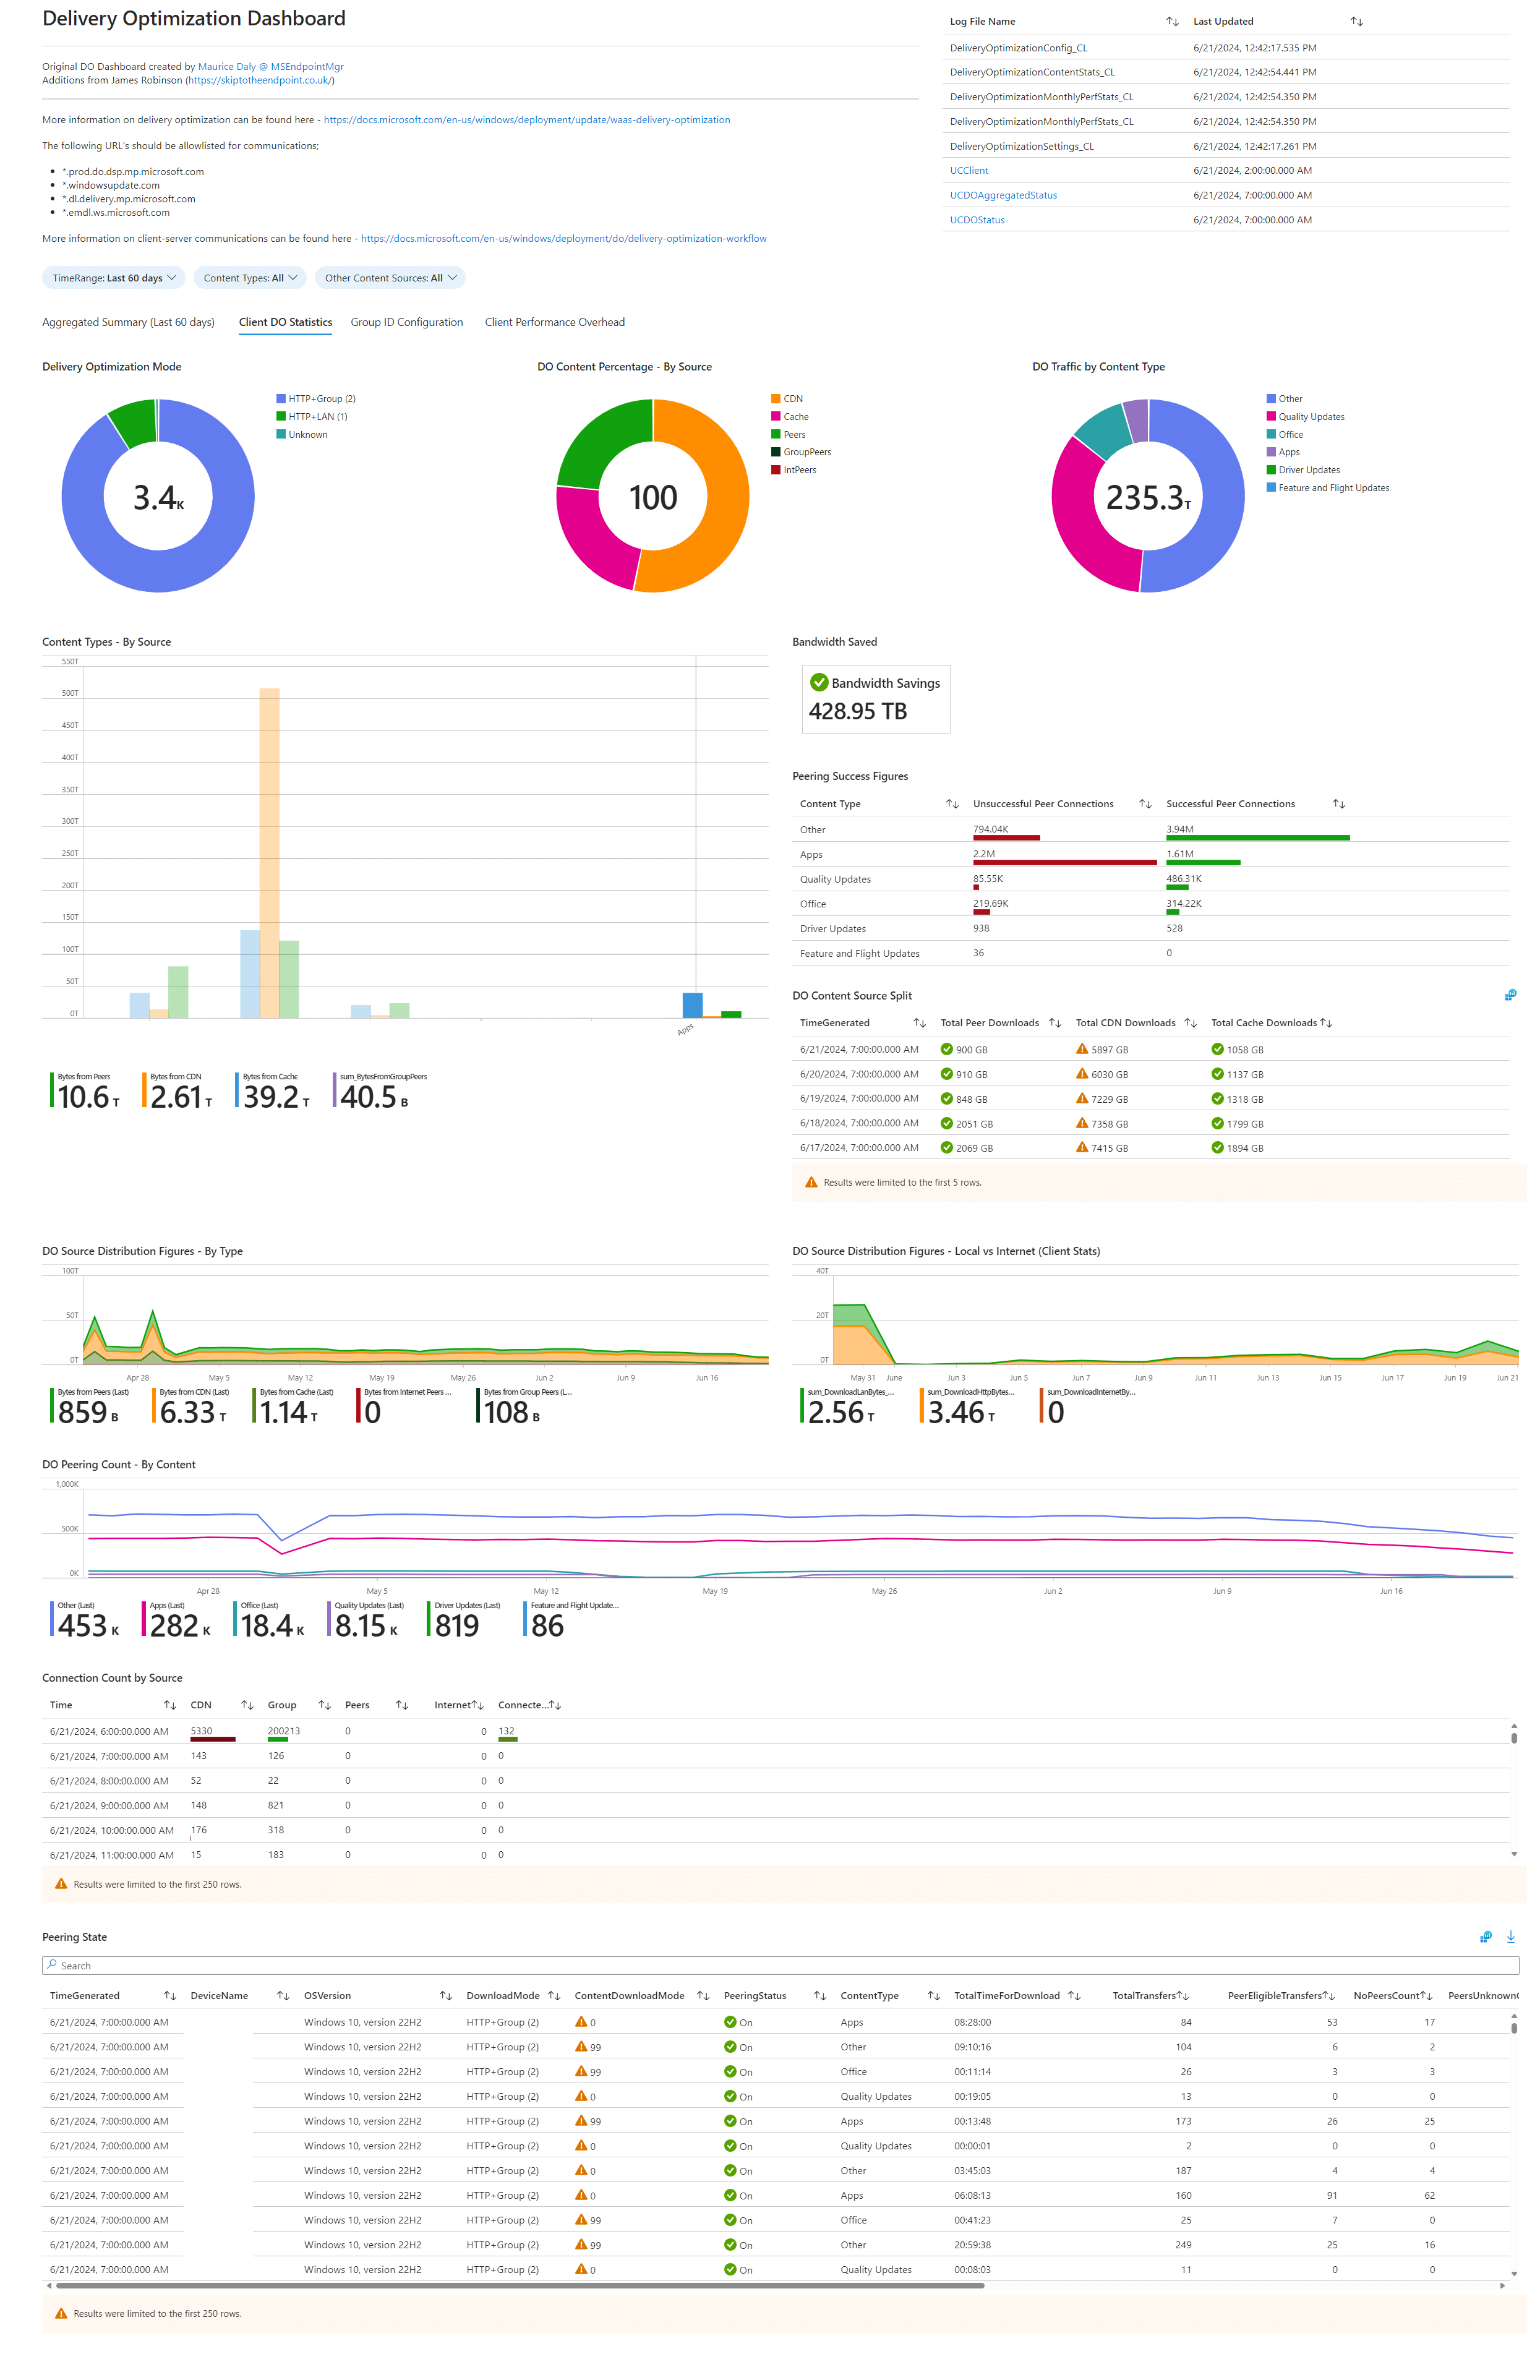
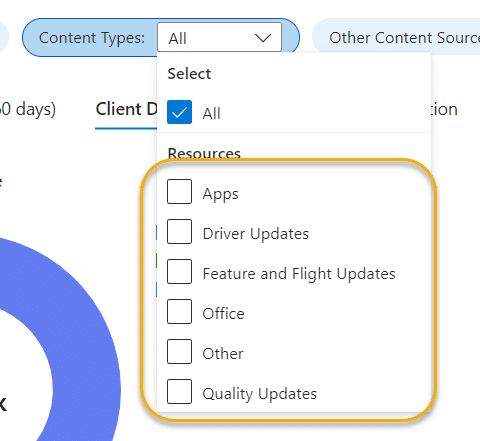
In the updated workbook, I have also included a parameter set to allow you to filter on category;
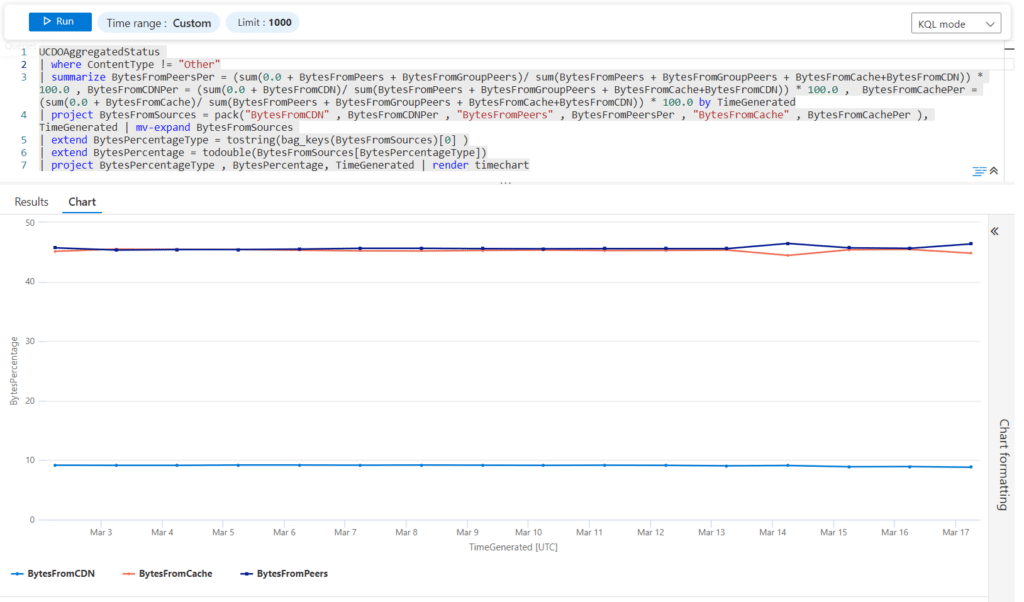
This is where you can see that in fact if we were to leave out the “other” category, you can clearly see efficiency in this example is quite good in this environment;
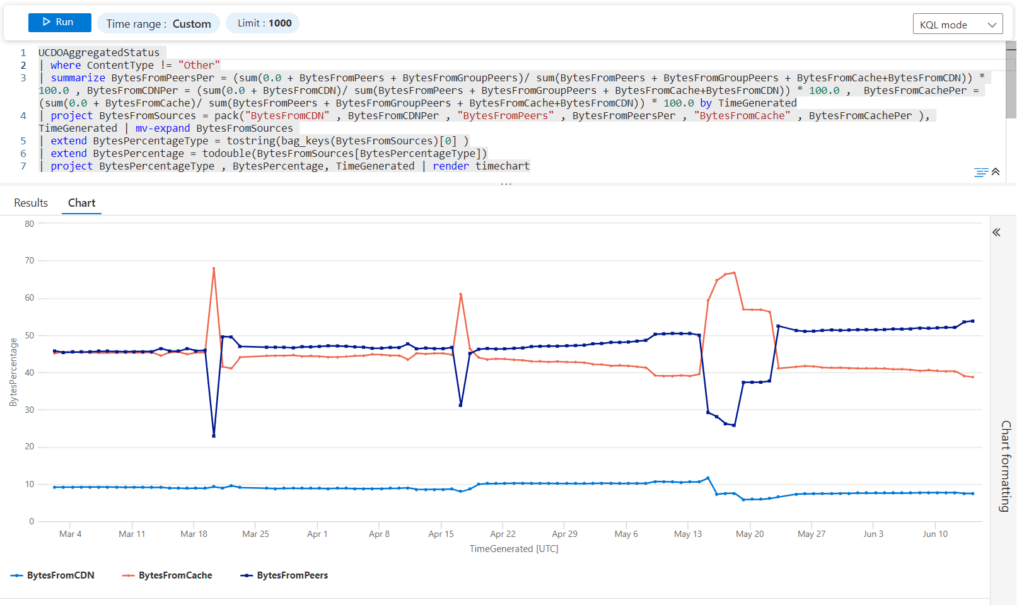
Running the query over a longer time period, and with additional tweaks to the DO policy, you can see that overall the efficiency has improved slightly;
The updated workbook and the associated collection group (used with custom log ingestion covered in this post – (Securing Intune Enhanced Inventory with Azure Function – MSEndpointMgr) is available on our GitHub;
Collection Script – Reporting/Scripts/Invoke-DeliveryOptimizationDataGatherScript.ps1 at main · MSEndpointMgr/Reporting (github.com)
Workbook Code – Reporting/Workbooks/DeliveryOptimizationDashboardV3.json at main · MSEndpointMgr/Reporting (github.com)
Delivery Optimization Overhead
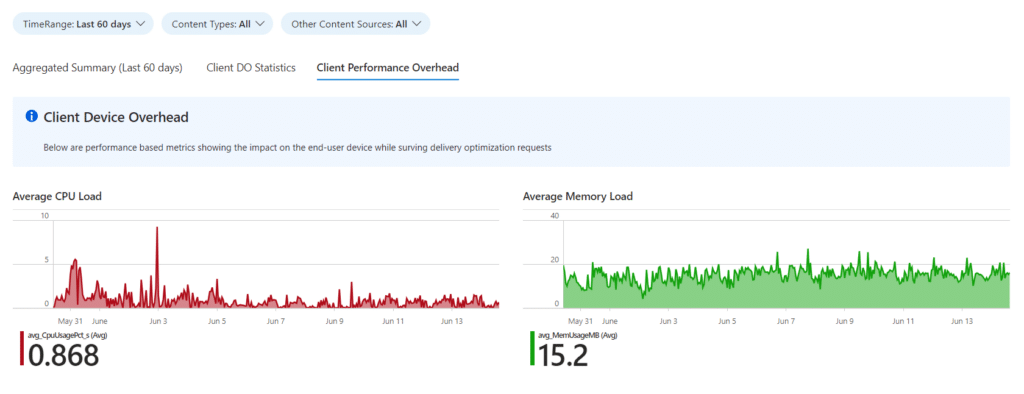
The benefit of collecting DO stats directly from the devices is you can pick and chose what you want to report on, and in some cases, go beyond what the UCDO logs provide. In this example, which has been added to the workbook, we can quantify the overhead on the clients, both in terms of memory, and CPU.
As you can see from the below screenshot, DO itself is nothing to worry about (or at least in my test environment), and this serves as a reporting backup for when you want to push the button, but get the “How will it impact the end user?” question thrown at you.
Conclusion
Delivery Optimization is a great solution to implement within your organisation, helping you reduce network overhead, while leveraging a very low overhead on clients. Is there a one size fits all configuration? No is the short answer, but with some TLC to your policies and understanding of your network design, you can make DO work very well indeed (where traffic supports DO of course).
IMPORTANT – As always, please ensure you keep an eye on the associated cost of custom log data collection in Log Analytics. This is your responsibility, and the collection scripts are provided AS IS with no support / liability.
I hope you found this post useful, and special thanks to James Robinson, Phil Wilcock, and those on the Microsoft DO product team.










Hi, thanks for this great article. Didn’t know about the awesome troubleshooter script. Looks like DNS-SD is a great option to add as well.
Which DO download mode do you recommend in enterprises? Default 1-LAN or 2-GROUP ?
Currently we are using Do mode 2 with SCCM boundaries as GroupID
The short answer is “it depends”. In general though using option 2 (Groups) is my recommendation, but if you are a small organisation, option 1 might serve you well. In relation to the group source ID, I am not sure how you are using SCCM boundaries as this is not an option. The options available are “Unset, AD Site, Authenticated Domain SID, DHCP User Option, DNS Suffix, AAD”, and here I would recommend using the DHCP User Option with option 234 and GUID defined for each subnet, or sharing the GUID where it makes sense.
Ok thanks for your reply.
When having a sccm environment and devices use a sccm client, you can configure DO policy in the client settings on the sccm server console.
There you can enable the use of Boundary groups for DO Group ID.
OK, so you are of course using co-management with the settings defined within the client settings. Sometimes I forget to think outside of the cloud native box. With that said, I do prefer the visibility of settings from the policy in Intune, and if you are co-managed, and going “cloud native”, it can make sense to have a single source of configuration where possible.