

Intune Debug Toolkit is a community-developed Windows launcher, maintained by Mattias Melkersen from MSEndpointMgr, that puts every Intune / Windows diagnostic script and tool the community has published behind one keyboard-friendly UI. Instead of hunting down a dozen scripts and remembering how each one works, you pick a tool from the sidebar, watch its output stream live, save the log if you need it, and move on to the next one.
Version 3.0 is a full rewrite of the launcher, same mission, new engine. It’s now built on Avalonia (.NET 8) with a dark, modern interface, and every bundled tool was re-verified against current Intune Management Extension and Windows Update log formats, with several long-broken parsers rewritten from scratch.
Bundled tools and their original authors:
- IntuneDebug RSOP – Jonas Ohmsen’s GPResult-like report for Intune
- IME Diagnostics – Petri Paavola’s timeline + log viewer
- SyncML Viewer – Oliver Kieselbach’s OMA-URI / SyncML debugger
- Windows Intune Log Reader – Somesh Pathak’s Flutter-based log browser
- Intune Device Details GUI – Petri Paavola’s WPF device dashboard
- Autopilot device prep (AutopilotV2) – Rafał Zimonczyk’s Autopilot diagnostic utility
- Autopilot Test Attestation – Rudy Ooms’s attestation checker
- Autopilot Readiness Check – Jannik Reinhard’s pre-enrollment readiness checker
- CMTrace – Microsoft’s classic log viewer
- Intune On-Demand Collection – Microsoft’s diagnostics collector, fetched fresh from aka.ms each run
- Remediations Reader, Win32 App Re-run/Inspector, Windows Update for Business Readiness, MDM Event Log tailer – rewritten in-house by Mattias Melkersen against the current log formats

Prerequisites
In order to use the Intune Debug Toolkit you need to have the device to debug at hand (If you need to debug remote, then use the built-in function in Intune):
- Windows 10 or above
- Administrator rights on the device – required for any tool marked admin in the sidebar; tools without that tag run fine as a standard user
- Internet access – a handful of tools pull a PowerShell module from the PowerShell Gallery or Microsoft Graph the first time they run (RSOP, Autopilot Test Attestation, Win32 App Re-run/Inspector, Intune Device Details GUI, IME Diagnostics)
- A Microsoft Graph sign-in – needed specifically by Intune Device Details GUI and Win32 App Re-run/Inspector, which both query Graph for live device/app data
- Nothing else. The shipped MSI is self-contained. No separate .NET runtime to pre-install.
Install
Go to the link here and download the MSI
From an elevated shell:
msiexec /i IntuneDebugToolkit-<version>.msi /qb
This installs to %ProgramFiles%\Intune Debug Toolkit and adds a Start Menu shortcut under “Intune Debug Toolkit”.
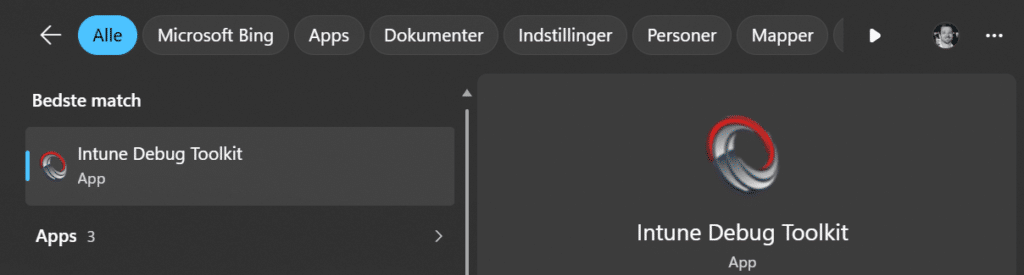
Uninstall from Settings → Apps → Installed apps, same as any other app.
Deploying at scale through Intune as a Win32 app works the same way it always has: wrap the MSI with the Win32 Content Prep Tool, install command msiexec /i "IntuneDebugToolkit-<version>.msi" /qn, detection rule = MSI product code (Intune fills this in automatically once you upload the .intunewin).
If a device already has an older version installed, running the new MSI cleanly replaces it – no need to uninstall first.
The window is split into a sidebar on the left (every tool, grouped into categories like Diagnostics, Enrollment, Logs, MDM Protocol and Updates) and a tabbed console that fills the rest of the window.
Everything runs in its own tab, and nothing is lost when you multitask. Click a tool in the sidebar and it opens a new tab and starts running immediately. Click three more tools and you get three more tabs, each running independently – kick off a Win32 app rerun, an Autopilot readiness check, and the MDM event log tailer all at once, and flip between their tabs freely. Switching tabs, filtering one tab’s output, or even closing other tabs doesn’t stop or clear what’s running elsewhere. Every tab keeps streaming its own output for as long as its tool is running.
A few tools (SyncML Viewer, CMTrace, Intune Log Reader, AutopilotV2, Intune Device Details GUI) pop open their own native window in addition to their tab – the tab still tracks whether the process is running so you always know its status and can stop or re-run it from the same place as everything else.
Reading the console. Output streams into the tab live, colour-coded so the important lines jump out: errors in red, warnings in orange, success lines in green, and status/section lines dimmed. Long, noisy sections – like a Proactive Remediation script’s full detect/remediate body – automatically collapse into a one-line summary you can click to expand, so the tab stays scannable even on a chatty tool.
Use the filter box under the toolbar to narrow what’s visible in the current tab to lines containing your search text (case-insensitive). This only changes what’s displayed – the full output is still there, and still gets saved in full regardless of what’s filtered or folded.
Toolbar, per tab:
- Re-run – start the tool again from scratch in the same tab
- Stop – terminate the running tool (and anything it spawned)
- Save log… – copy the complete on-disk log for this run to wherever you want, even if you’ve filtered the view or collapsed sections
- Open log folder – jump straight to the folder where every run’s log lives on disk
A status pill in the top-right corner of each tab shows Running (with a pulsing dot and an indeterminate progress strip at the top of the console while it’s active), Completed, or an exit code if the tool failed.
Elevation. The top-right corner of the app window shows whether the launcher itself is running as Administrator or Standard user. Tools that need elevation carry a purple admin chip next to their name in the sidebar. If you launch one of those while running as a standard user, the app tells you right away instead of letting the tool fail silently – close it and relaunch Intune Debug Toolkit as Administrator.
Live-updating catalog. The list of tools comes from a tools.json file next to the app; if you (or a future update) edits it while the app is open, the sidebar refreshes on its own, or you can force it with the Reload button top-right.
Diagnostics
Intune deep diagnostics collection (admin) Collects MDM/Intune logs locally without needing the cloud-side “Collect diagnostics” action from the Intune portal — handy when you need a diagnostic bundle to attach to a Microsoft support case, or you don’t have Intune admin rights to trigger the cloud collection. Uses Microsoft’s own On-Demand Collection tool, fetched fresh each run.
Intune Device Details GUI Petri Paavola’s WPF dashboard, opens in its own window after you sign in with Microsoft Graph. Gives a complete picture of the device and the signed-in user: recent check-ins, assigned applications, configuration profiles, and group memberships, all in one place.
Apps & Policies
IME Diagnostics (with timeline + log viewer) Runs a timeline-and-log-viewer pass over the Intune Management Extension logs — Petri Paavola’s log analyzer, wired into the console tab so you get a chronological view of what IME actually did on this device alongside the raw log lines.
Win32 App Re-run / Inspector (admin) Inspects Win32 app deployment straight from the IME logs — install/uninstall command, detection method, current state — and lets you force a redeploy right away instead of waiting for the next 24-hour evaluation cycle. Rewritten for v3 with modern GRS hash discovery, so redeploys actually fire against current-generation IME.
Remediations Reader (admin) Shows detect/remediate results for every Proactive Remediation targeted at this device, read straight from the modern IME cache. Each script’s full body folds into a summary line in the console so you can scan results quickly and expand only the ones you need.
RSOP (GPResult-like) Installs and runs Jonas Ohmsen’s IntuneDebug PowerShell module to produce a GPResult-style report of which policies actually won on this device and where they came from — the closest thing Intune has to the classic gpresult experience for hybrid or co-managed devices.
Enrollment
Autopilot Readiness Check (admin) Verifies the prerequisites for a successful Autopilot enrollment before you attempt one — network reachability to the right endpoints, TPM state, OS edition, and more.
Autopilot Test Attestation (admin) Runs a TPM attestation test to confirm the device can actually complete Autopilot attestation, catching devices that will silently fail this step during real provisioning.
Autopilot device prep (admin) Rafał Zimonczyk’s Autopilot diagnostic utility (AutopilotV2), opens its own window. Can also prepare a device for Autopilot enrollment directly.
Logs
Watch MDM Event Log (admin) Live-tails the Windows MDM event log with colour-coded highlighting right in the console tab, so you can watch policies land (or fail) in real time instead of digging through Event Viewer afterwards. The full trace is always saved to disk even after you close the tab.
Intune Log Reader (admin) Somesh Pathak’s Flutter-based log browser for IntuneManagementExtension logs, opens its own window — built for quickly searching a specific area of a large IME log.
CMTrace Microsoft’s classic log viewer. No longer distributed standalone by Microsoft, but works just as well on Intune logs as it always did on ConfigMgr logs. No admin rights needed.
MDM Protocol
SyncML Viewer (admin) Oliver Kieselbach’s live SyncML message viewer, opens its own window. Watch the actual OMA-URI traffic between the device and Intune in real time — the best way to see exactly what a policy sync is adding, changing, or removing, and to confirm whether unassigning a policy actually rolls it back or leaves it tattooed on the client.
Updates
Windows Update for Business Readiness (admin) Breaks down where this device’s updates are actually coming from — WUfB, WSUS, or Microsoft 365 Apps’ own update channel — with category breakdown, failure highlighting, gap analysis, and a deduplicated timeline. Built for exactly the confusion that shows up mid-migration from WSUS to Windows Update for Business.
Source code repositories
Intune Debug Toolkit source code can be found at the following locations:
- Is this tool free?
- Yes, it’s licensed under the MIT license and a compilation of many other great contributors in the community. (all contributors can be found on the overview page or in the change log on GitHub)
- Can I debug remote on clients?
- No. This tool is meant to be used while having the device within reach. If you need to debug on a computer that is not available physically then use the built-in debug function in Intune and gather logs.
- How will Intune Debug Toolkit be updated?
- I have communication going on with all the stakeholders and I do very much care for the tool works as expected. If any bugs needs to be reported, please do so, and please also give feedback if you think you need more or better insights.
- Is there any support for Intune Debug Toolkit provided by the developers?
- This is community based and will not have any kind of support. Be welcome to reach out, but no one of the developers will be obligated to help free of charge.
- How do I report an issue with Intune Debug Toolkit?
- We prefer that bugs are reported on the official repository. Links are provided in the Source section.