

Almost two weeks ago I released a pretty generic report on reporting patch compliance using PowerBI and System Center Configuration Manager and I was shocked at the amount of feedback I got from the community! So first I want to say thank you and then I want to let you all know that I’ve got a new and improved version of the report!
If you just want to go download the version of the report and start playing with it you can find it on TechNet Gallery: Patch Compliance With PowerBI – V1.0.0.7
Major Updates:
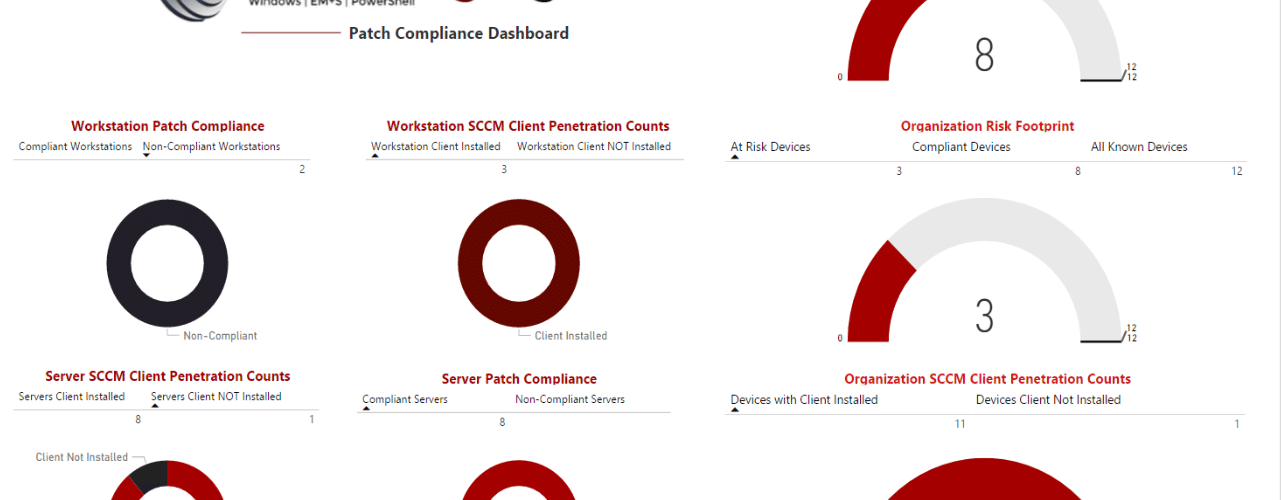
- Organization Overview Tab – Consolidated view of patch compliance for your organization – Shows Server Patching, Desktop Patching and, ConfigMgr client penetration.
- Workstation Patch Compliance – Previously only had a single tab for Server Patch Compliance (I’m primarily a server admin forgive me).
- Server Client Penetration – A very rough spin into finding clients that don’t have the agent installed filtered by has the device authenticated to AD within X number of days.
- Includes count of client versions in the environment
- Workstation Client Penetration – A very rough spin into finding clients that don’t have the agent installed filtered by if the device has authenticated to AD within X number of Days
- Includes count of client versions in the environment
- Workstation/Server Tab now includes a drop down to filter Articles by membership in a specific Software Update Group.
Minor Updates:
- Color Theme Change – Based on some conversation with members of the community realized the default colors might be hard to see so the report has been skinned using a custom theme that should hopefully be more color-blind friendly.
- SCConfigMgr Logo – Added the website logo to it, you can of course replace it with your own.
- Additional SQL Queries – In order to support some of the changes in the Major Updates section minor SQL query changes were made, and some new queries were added, more on that later.
- Graphics Changes/improvements
Possible Future Updates:
- Clients Last WSUS Scan time
- Last WSUS Scan Server Location
- Last WSUS Scan Status Code – (And maybe a suggestion what’s broken if something is broken)
- Possibly including devices where path status is ‘unknown’
- Currently, this is not done as it pulls in a very large amount of data as it requires usage of V_Update_ComplianceStatusAll which is a much larger dataset.
- Additional Generic Client Health Maybe?
In order to facilitate a large number of these changes, I had to modify some existing SQL and add an additional query or two. I strongly encourage you to run the queries that power the report on their own in SQL Server Management Studio to assess the impact on your environment especially the query that collects patch compliance information.
SQL Queries Leveraged
Update Compliance Information
Select v_R_System.name0 as 'Name'
       , v_RA_System_ResourceNames.Resource_Names0 as 'FQDN'
       , v_R_System.Resource_Domain_OR_Workgr0 as 'DOMAIN'
       , v_GS_OPERATING_SYSTEM.Caption0 as 'Operating System'
       , CASE v_GS_OPERATING_SYSTEM.ProductType0
            WHEN 1 THEN 'WORKSTATION'
            WHEN 2 THEN 'DOMAIN CONTROLLER'
            WHEN 3 THEN 'SERVER'
        END AS 'OSCLASS'
       , V_UpdateInfo.ArticleID
       , CASE
            WHEN v_Update_ComplianceStatus.Status = '2' THEN 'MISSING'
            WHEN v_Update_ComplianceStatus.Status = '3' THEN 'INSTALLED'
        else 'UNKNOWN'
        END AS 'PatchStatus'
       , V_UpdateInfo.DateCreated
           , V_UpdateInfo.Title
           , V_UpdateInfo.InfoURL
           , V_R_System.ResourceID
from v_R_System
left join v_Update_ComplianceStatus on v_R_System.ResourceID = v_Update_ComplianceStatus.ResourceID
left join V_UpdateInfo on v_Update_ComplianceStatus.CI_ID = V_UpdateInfo.CI_ID
left join v_RA_System_ResourceNames on v_R_System.ResourceID = v_RA_System_ResourceNames.ResourceID
left join v_UpdateScanStatus on v_R_System.ResourceID = v_UpdateScanStatus.ResourceID
left join v_GS_WORKSTATION_STATUS on v_R_System.ResourceID = v_GS_WORKSTATION_STATUS.ResourceID
left join v_GS_OPERATING_SYSTEM on v_R_System.ResourceID = v_GS_OPERATING_SYSTEM.ResourceID
where V_UpdateInfo.DateCreated BETWEEN '2017-01-1 00:00:00.00' and GetDATE()  and v_UpdateInfo.IsDeployed = '1' and v_UpdateInfo.CIType_ID = '8' and v_UpdateInfo.IsSuperseded = '0'
Client Info Query
select V_R_System.Name0
    , CASE V_R_System.Client0
              WHEN 1 THEN 'INSTALLED'
              ELSE 'NOT INSTALLED'
          END AS CLIENTSTATUS
    , V_R_System.Client_Version0
        , V_R_System.Operating_System_Name_and0
        , v_R_System.Last_Logon_Timestamp0
        , v_GS_OPERATING_SYSTEM.Caption0 as 'OSIfClientInstalled'
from v_R_System
Left OUTER Join V_GS_Operating_System on V_R_System.ResourceID = V_GS_Operating_System.REsourceID
Software Update Group Members
with SUGInfo as
(
    Select V_UpdateInfo.CI_ID
        , v_UpdateInfo.CIType_ID
        , V_UpdateInfo.Title
    from v_UpdateInfo
    where v_UpdateInfo.CIType_ID = '9'
)
Select SUGInfo.Title as 'SoftwareUpdateGroup'
    , v_CIRelation.FromCIID
    , v_CIRelation.ToCIID
    , V_UpdateInfo.ArticleID
    , V_UpdateInfo.Title
from SUGInfo
Left Outer Join v_CIRelation on SUGInfo.CI_ID = v_CIRelation.FromCIID
Left outer Join v_UpdateInfo on v_CIRelation.ToCIID = V_UpdateInfo.CI_ID
Update Information
Select V_UpdateInfo.ArticleID
     , V_UpdateInfo.Title
     , V_UpdateInfo.InfoURl
from V_UpdateInfo
Where V_UpdateInfo.ArticleID is NOT Null and V_UpdateInfo.ArticleID !=''
Just as a quick review when you download the template and open it you’ll be greeted by the same prompts as before here is a quick video example of how to change the datasets. I also want to give a big shout out to Maurice Daly for all of his edits and help in making this look more streamlined.
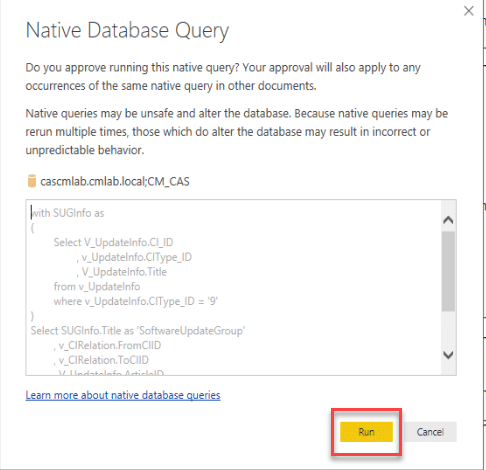
Now, you might be prompted by Native Database Query Security and you’ll be asked for approval to run each query individually. This is a security feature of the product and CAN be disabled. I’ll show you how.
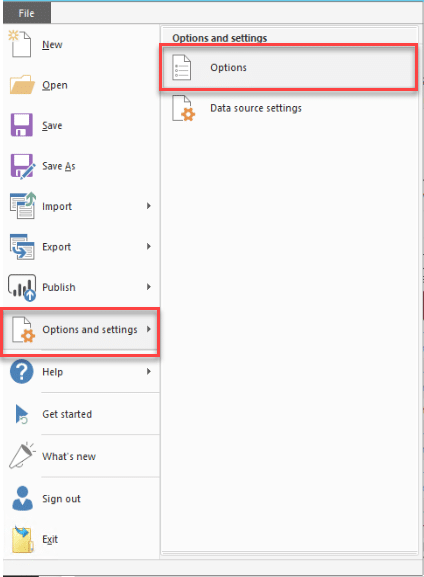
If you want to disable the above annoying query approval from popping up every time you put a new query into PowerBI – I for one do disable it because the only person who puts queries in there is me, and only after I’ve tested them in SSMS – you can do so by doing the following. File->Options and Settings -> Options -> Security
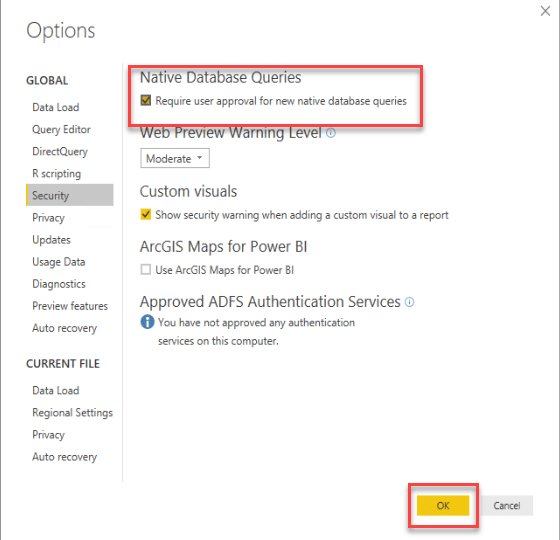
In the security tab of the Options popup un-check the ‘Native Database Queries’ option that requires approval and hit OK. Please, only do this if you know what you’re doing and you are absolutely sure queries that go in PowerBI have been tested.
If you have any questions about what the different rings mean and the criteria I’ve used please feel free to ask questions.


Jordan,
How can I modify the compliance queries so that it also shows computers that don’t need any updates as part of the compliant? Or to also show unknowns?
This is a little tricky especially the unknowns as querying to pull back all of the unknowns especially in large environments requires you to query the ALL status table which can return back a massive amount of data.
Can you go into what you’re trying to present data wise and maybe I can help you out.
Cheers!
Ok, then could we just include the machines that don’t need any of the updates? Understand on the unknowns.
Hi Jordan,
Wonderful dashboard you’ve created here. I do however have one question.
Is it possible in a simple way to incorporate a collection filter? I have a different set of devices that need to be patched every month. Being able to filter on a SUG (already possible) AND a collection would make this even better.
I forgot to update the main body of the post but there is a new version of the Template with a collection ID picker!
https://github.com/MSEndpointMgr/ConfigMgr/blob/master/Reporting/SCConfigMGR-Patch-ComplianceV1.0.0.8.pbit
You can download it there!
Cool. Thanks for getting back to me this quick. I’m trying it out right now but can’t seem to change the embedded sources. There are 2 datasources, yourserver;YOURDBand yourservername;YOURDB.
I can change the yourserver;YOURDB to match my environment, but the second one can’t be changed. The Change Source button is greyed out.
I also can’t view the query associated with ComplianceInfo and CollectionMembership so I can’t hack it into the existing report I have already.
Nevermind, I just noticed the Youtube link in the reply above mine that explains the need to change the datasource settings in the Advanced Editor.
Hi Jordan, absolutely love the PowerBi implementation of a decent software update dashboard, I’m pretty new to PowerBI and I’ve added what I want in terms of a control field for the server dashboard (added CollectionID query below as a query in query editor).
Basically I want to use a collection to control what is presented rather than “SoftwareUpdateGroup” – the way we chop up our monthly cycle the Update group is of no use, here is the SQL I use for an SSRS report, how easy / how would I replace the softwareupdategroup with a collection picker
”
let
Source = Sql.Database(“SQLSERVER”, “SITE”, [Query=”SELECT DISTINCT SiteID AS ‘Value’, CollectionName AS ‘Label’ FROM v_Collections
where CollectionName like ‘wsus%’
ORDER BY ‘Label'”, CommandTimeout=#duration(0, 0, 5, 0)])
in
Source
“
worked it out
created another query that pulled through the name (machine), Collection ID and Collection name that every machine was a member of that started with WSUS then used that as a filter similar to SUG group to filter the results by collection membership and just hid the sug info as it was of no use to us with the way we roll out patches monthly (controlled by collection not SUG)
I forgot to update this in the main boxy of the post but there is a new version available here: https://github.com/MSEndpointMgr/ConfigMgr/blob/master/Reporting/SCConfigMGR-Patch-ComplianceV1.0.0.8.pbit
And it includes a collection ID picker.
Here is a youtube video on how to implement it!
https://www.youtube.com/watch?v=0vmBBHk0CV4&t=
Hi Jordan, i love your report.
The only problem I have is field Patches Being Evaluated. I see only this year’s updates, despite the different settings (Before, Between….). But when I open Power Query Editor and SoftwareUpdateGroupInfo all updates are visible.
Tnx, Andrej
There is a reason for that, when I wrote the query for that side I limited it to only show patches for X number of days in the past using the ‘Days in the past’ variable.
I did this to help allow people to pick how far back some of the information goes. You should be able to modify this pretty simply. You will see the other updates because of how things are set up to retrieve updates in the SUGS but it shouldn’t show you their compliance (the resource heavy part) till you extend the date range that far back.
Hello,
When I select Server patch Compliance , it is Showing Windows 7 Software Update group
Hi Chris. This looks amazing! We have been attempting to develop somethign similar (with some very annoying constraints in data access – see below)
Is there anyway to decouple the query and presentation layers here? Unfortunately some of my clients work in secure envirornments and whilst I am able to use PowerBI Desktop. We aren’t able to link the presentation layer to the backend DB.
My thoughts being I could extract all the data as a CSV and somehow feed in the raw extracts to your presentation?
Appreciate the view!
Dave,
Thanks for your patience. You absolutely can do this! If you look in the video I believe I show how to view the default query that builds the dataset.
If you copy that Query out and run it in SQL it will return the dataset at which point you can just dump it into a spreadsheet for leadership to do whatever with. I do this on a semi-regular basis for the management that likes to see ‘everything’
Cheers,
-J
This looks likely to save me a lot of work – thank you ever so much for sharing it. I do have at least one issue to resolve already though…
It seems a subset of my devices have 2 entries in Resource Names – the FQDN and short name. So each device shows twice in the ‘All missing patches per server’, and lists it is missing 2 patches in ‘Summary Server Compliance’, while you are assessing compliance for 1 patch.
I’ve no idea why some have 2 entries for Resource Names, and some have just the FQDN, or how to remove the short name version from devices.
I appear to have worked around this by deleting the 2 entries for v_RA_System_ResourceName. The line in the select and the left join line in ComplianceInfo. Not sure if there will be any consequences of this, or why I have duplicate resources names, but mentioned here in case anyone also has duplicates.
Very informative patch status dashboard! nice work! one suggestion would be to add some compliance settings CIs to report back awaiting reboot status on patches and incorporate that data into the dashboard.
Is there any way to get information regarding when a patch was actually installed on the machine? i’ve been looking in the SQL view documentation but can’t seem to get around it.
that’s the last piece of my puzzle i’m missing :p
So… ‘Kinda’ there are two answers to this question.
1) If you are extremely trusting of WSUS you can use the V_UpdateCompliance.LastStatusChangeTime field and that ‘in theory’ should tell you the last time the compliance changed and assuming that last change was from non-compliant to compliant. You’re all set.
2) Implement the QFE hardware inventory information/collection and link that. This also comes with its own caveats of – not all updates are stored in quick fix engineering, and your now dependent on hardware inventory AND compliance data linking up together.
Two methods, just depends on which way you want to go.
Hope that helps.
-J
Hey Jordan,
So i was actually looking at the right field with the laststatuschangetime.
I was testing it before by adding it to your query but i was getting dates for patches that are still missing. So I got confused about it.
But basically it means that when a patch is missing that field is filled in with the date/time of the last compliance scan. Meaning it will update the moment I install the patch?
Tomorrow i’m going to check with the Quick fix engineering hw inventory, did not know about that, so thanks for that!
just curious what option you would pick ? :p
again many thanks for the awsome dashboard !!
following closely on twitter in case you make updates on it 😉
“But basically it means that when a patch is missing that field is filled in with the date/time of the last compliance scan. Meaning it will update the moment I install the patch?”
It won’t update the EXACT moment you install it but after it installs, and then the NEXT compliance scan. Now if you have configured your Software Update Deploymetns to Scan after install and reboot… thats pretty close.
Quick Fix Engineering with HW inventory is pretty cool, I think we have a post on it somewhere… I’ll look and if we don’t I’ll make one!
I use both fields as sometimes the data I want is in one sometimes the other just depends on what I’m looking for.
Thanks for the follow on twitter! I’m planning on some new updates coming in the next week or two!
Yeah i’ve got mine configured like that, so that should be reliable data!
ooh, I think i’ve missed that post if there was any , Adding that one to my list to check tomorrow ! going to test it tomorrow and see if i can alter your query to get that data in it.
Really, many thanks for your kind reply & awsome Dashboard !
a few weeks ago i was really lost in getting some good compliance reports, this dashboard is really helping me reporting wise for SOx !
Cheers Jordan !
Nice report, I do not seem to see any of the 2016 servers in the server patch compliance tab. The 2088 and 2012 work fine.
Take a look at filters should see them in there might be something that is causing them to get pulled out but they should show up in the default way.
Don’t worry about the double post I cleaned em up 😀
I have opened up everything. I have 20 servers 10 of which are server 2016. I know they all need 11/14/2017 patches. I only see 10 compliant and nothing under non compliant. I selected all domains, all Software update groups, patch status select all, Only 10 servers show up as non compliant non are my 2016 servers. Am I missing something? I can see in other reports that they are non compliant.
Hi Jordan,
Been looking at the queries and i seem to be at a loss when it comes to a minor change ive made… I simply added IsDeployed from the v_UpdateInfo view – problem is that i see updates that i know are deployed, register with a “0” in IsDeployed. So I’m wondering whether the data is “correct” when looking at views used. Perhaps if you can confirm whether my finding is correct or faulty?
/H
Hello Henrik!
Sounds like what you’ve done is just added a column to the query then removed the where filter on ‘IsDeployed’ and are seeing that some of the updates that are set to 0 are actually deployed in the environment? That shouldn’t be the case. I would start by double checking the data in your console. Find the article ID of a specfic update you think is deployed and check the console to confirm under ‘Software Lbrary -> Software Updates -> All Software Updates’
Cheers,
-J
I can confirm that this is exactly the case, the specific update is registered as IsDeployed in the Console but not in the DB view.
Thank you for this report. Just one question – What’s the difference between non-complaint and atriskdevices? Just implemented SUP and deployed ADR to a few groups (few hundred machines). My at risk devices are almost triple my non compliant devices?
Compliant-200
Non-Compliant- 100
At Risk- 290
The ‘At Risk’ column is built on a couple of pieces of information and depends on how you are filtering the report. The idea is to give an overall ‘risk footprint’ idea based on all patches released within the last 365 days that you have deployed. The ‘At Risk’ measure is a cumulative count of all devices – server and desktop – that are either non-compliant for patches OR are missing the SCCM agent. If you are looking to compare compliance level against a specific SUG/ADR I suggest using the Server and Desktop tabs and evaluating them individually as the dashboard tab is designed as a true ‘overview’ of an environment. If you think there is an issue with one of the measures let me know and I’ll double check the DAX expressions.
Ahh , thanks for the response. Was able to get the correct numbers with the correct filter added
No problem! Happy to help.