So far in this series we’ve talked how to use CMPivot to query online machines in your environment and what you can then do with that information. Now we’re going to take a step back from the tool itself and look at what ConfigMgr does with the data.
With the introduction of CMPivot to SCCM we have two brand new views we can query in SQL
- vSMS_CMPivotStatus
- vSMS_CMPivotTask
The first view – vSMS_CMPivotStatus reports on the status of the jobs that have been run from CMPivot it also lets you know the script version that was run the device it was run on how many other machines the script was run against and how many of those machines returned back that they were not online. All of the information for this view is built off three tables and two views as follows:
- ClientAction
- CMPivotResult
- System_DISC
- vSMS_ClientOperationStatus
- vSMS_Scripts
This is the part where I remind everyone that querying tables is bad form and we only query views. We only look at tables when we are trying to understand how things work and only in a lab so we don’t break the world. That being said if you peak inside of the CMPivotResult table you’ll notice its just where the information regarding the result status is stored before its shifted to the view there really isn’t anything ‘super secret’ in the table. In fact if anything the dependency relationship to vSMS_Scripts is probably the most interesting. With that in mind, vSMS_CMPivotStatus will likely be used primarily for reporting results on specific machines and finding issues.
The second view has far more relationships that run behind it and as a result is a lot more summary type information the tables and views it depends on are:
- ClientActionSummary
- ClientOperationResourceTarget
- ClientOperationTarget
- CMPivotResult
- CollectionMembers
- FnConvertBase64StringtoBinary
- fnGetSiteNumber
- fnlsCas
- Scripts
- vSMS_ClientOperationStatus
As you can tell, this view has a LOT more information in it but the information is summarized it doesn’t show what was done specifically to each client. Another thing I noticed is that it tracks the ‘run scripts’ actions that are run against the results of the CMPivot Query. It’s also important to notice that this information seems to turn over fairly quickly I haven’t dug deeply into how the data is groomed but I at a rough guess it only seems to retain the information for the last 7 days.
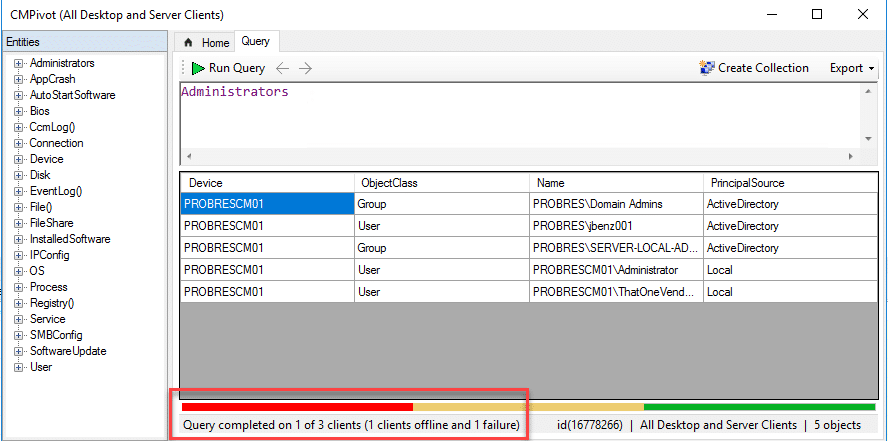
In an earlier post I made you may have noticed I ran a CMPivot query and as a result I got an error message from one of my clients however from within CMPivot there was no good way to see what that error was. However with our good friend SQL we can find out what machine had an error and why. For the purpose of this example we will again be looking to find all the local administrators.

As you can see I’ve run the ‘local Administrators’ query from CMPivot and for some reason I’ve got at least once client that has experienced an error. Since I want to know detailed information we are going to jump into the first view we discussed – vSMS_CMPivotStatus.
Whenever I first start dealing with a new view I always start with just selecting the top 10 rows of each column so I can start thinking about what columns I might actually need so
select top 10 * from vSMS_CMPivotStatus
This brings us back the first 10 rows in the view for all of the columns and from this we then can choose the information we care most and re-run the SQL query without the top 10 filter. This gives us something like this to work with:
select ScriptName
  , ScriptVersion
  , CollectionId
  , ResourceId
  , DeviceName
  , ClientOperationId
  , ScriptExecutionState
  , ReturnCode
  , ErrorMessage
 from vSMS_CMPivotStatus
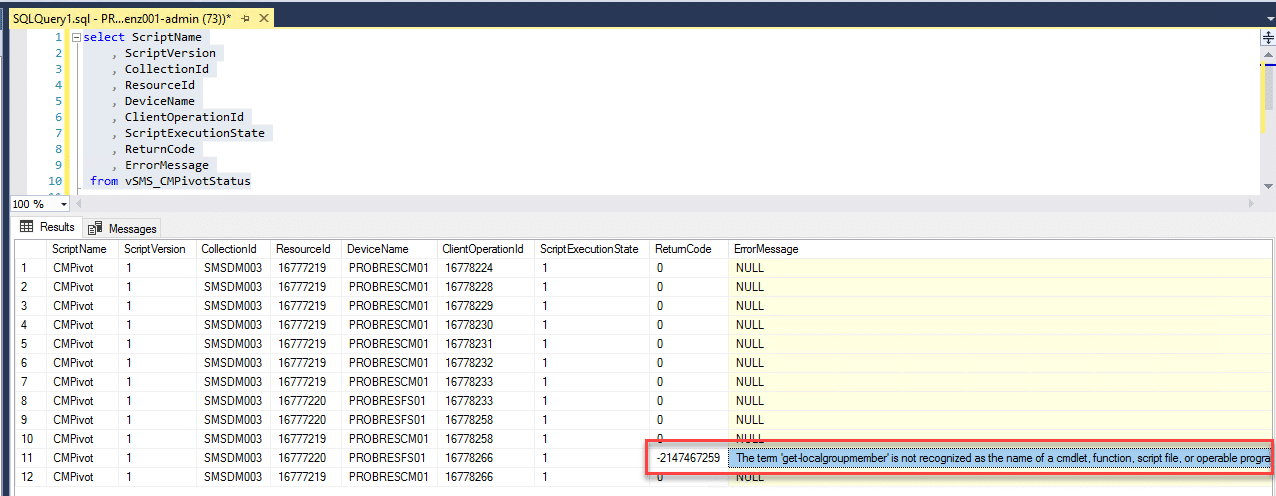
This then returns results that look like this:

The results now have shown us that on the server ‘PROBRESFS01’ a return code of ‘-2147467259’ was given with an error message of ‘The term ‘get-localgroupmember’ is not recognized as the name of a cmdlet, function, script file, or operable program. Check the spelling of the name, or if a path was included, verify that the path is correct and try again.’
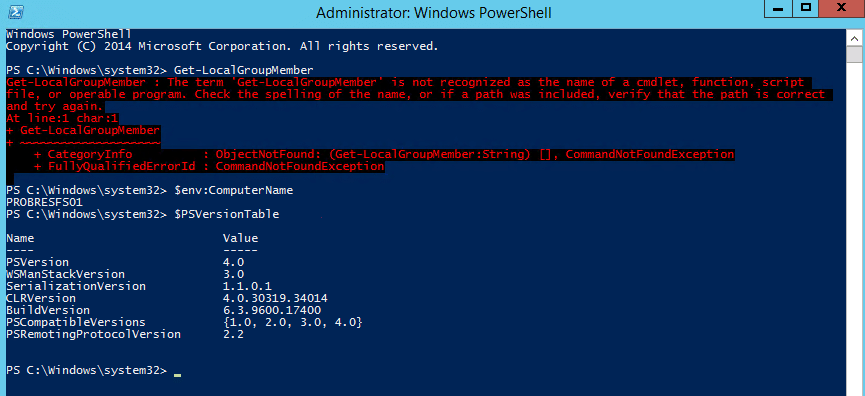
Now I happen to know that particular test server is a 2012R2 server I also know that the version of PowerShell installed does not have version 5.1 installed and therefore that cmdlet isn’t available for it to run this of course then results in the above failure.

Now I know this information isn’t a ‘pretty’ SQL report but I hope that it helps plan how to do some reports going forward and proves if you get an error from CMPivot you can track down what machine experienced an error and why. If people express an interest I’ll work to develop some reports in the future that have some more ‘prettiness’ factor to them as the feature continues to develop!
****Edit****
Just to toss a little more information in there after a discussion with fellow member of SCConfigMgr Sandy here are the logs from both the server side and the desktop side that are used to investigate the CMPivot actions:
Server side:
Smsprov.log
bgbserver.log
Statesys.log
Client side:
CcmNotificationAgent.log
Scripts.log
StateMessage.log
And a query that I came up with to help out with auditing when CMPivot was used in your environment and who used it granted at this time you still can’t see what information exactly they asked for.
select vSMS_ClientOperationStatus.CreatedBy
  , vSMS_ClientOperationStatus.RequestedTime
  , vSMS_ClientOperationStatus.TargetCollectionSiteID
  , vSMS_ClientOperationStatus.CollectionName
  , vSMS_CMPivotStatus.ScriptName
from vSMS_ClientOperationStatus
left outer join vSMS_CMPivotStatus on vSMS_ClientOperationStatus.ID = vSMS_CMPivotStatus.ClientOperationId
where ScriptName = 'CMPivot'


Add comment