

IntuneWin32AppRemedy is a Azure Automation solution and can be used in many different ways. This post will show how you can integrate my solution with almost any kind of Intune Win32 App management tool or solution you might have today, or at least give you an idea on how you can make your app management in Intune a bit easier. I will start with an overview of the components needed for the integration and then explain each step needed for automated patching of available apps managed by PMPC. You can read more about IntuneWin32AppRemedy in this blogpost and also read here on how to setup PMPC to run in Azure.
The Integration Components
The integration with PMPC have the following components that needs to be configured
- Azure Log Analytics Workspace
- Microsoft Monitoring Agent for Custom Log Injection to Log Analytics
- Azure Monitor Query Based Alert with action to trigger a Logic App
- Azure Logic App to fetch the variables for the Automation Runbook
- Some recommended configurations in Patch MY PC
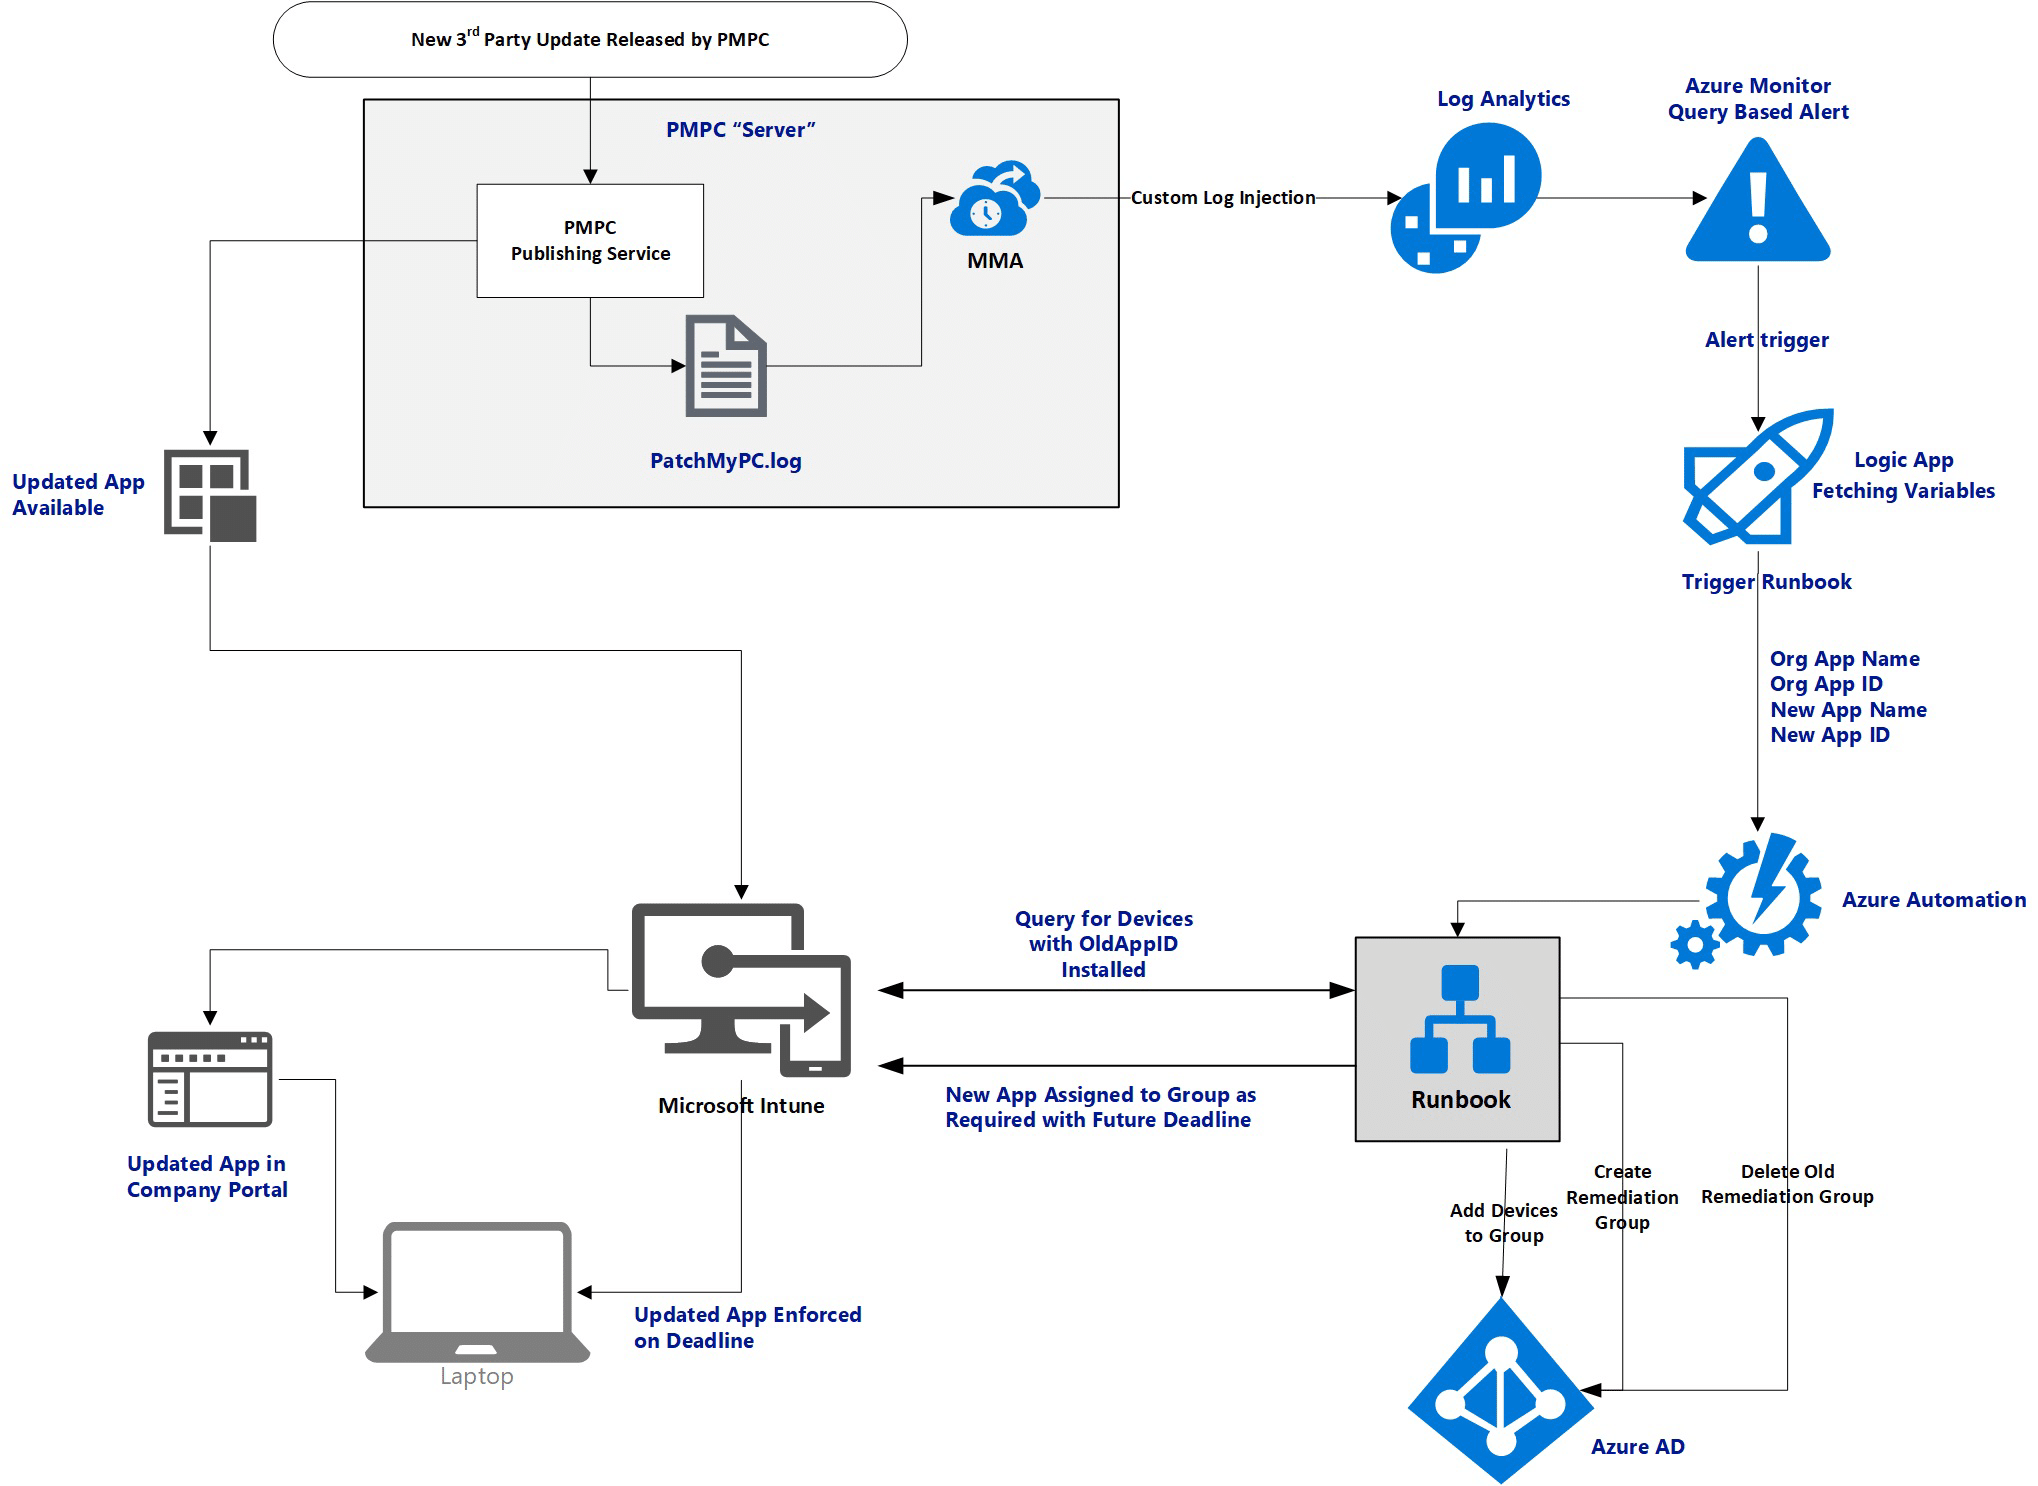
The total flow of the integration
Patch My PC recommended setup for IntuneWin32AppRemedy
This whole solution is based on that most apps are setup as Available to all users, and that we want to update the 3rd Party apps on all devices that have installed some of these apps. So first lets make sure we have setup Patch My PC to assign the apps to all users.
Start Patch My PC Publishing service and go to Intune Apps, right-click your app and choose Manage Assignments
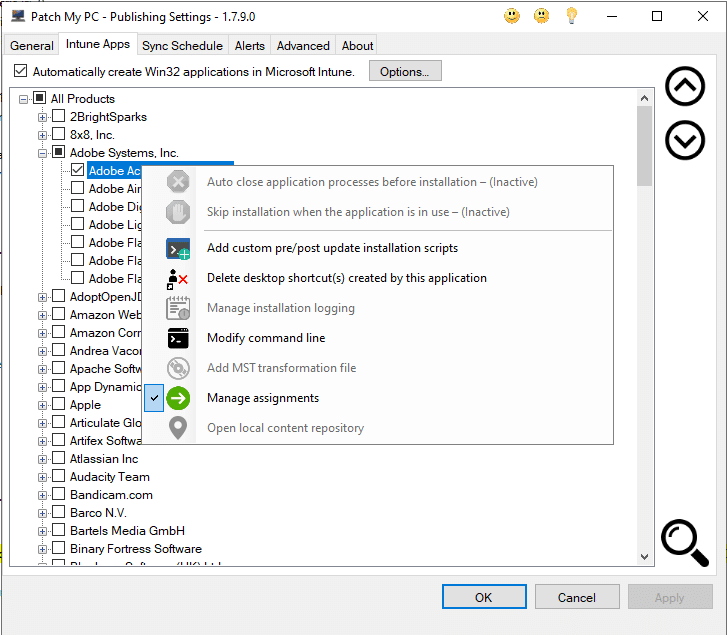
Now Click on Add assignment beside the Available for enrolled devices, and in this windows just click on the All Users in the bottom of the Window. Or choose the group you want to target with this app as available.


Now click OK. The next time this app gets and update it will be assigned as configured. The other option you have is to remove the app first. And then re-add it with this assignment setting.
The other thing we would like to do, is to NOT copy any assignments to the next version and remove assignments to the old version when the next update is published. Click on Options.. in the Intune Apps Window

Important: Do NOT enable Delete any previously created application when an updated application is created.
That will break the solution as we would not have a way of detecting who has previous version installed.
In next release of IntuneWin32AppRemedy, the runbook itself is going to handle deletion of the old app at the right time, after detection is finished.
Custom Log Injection to Log Analytics
To be able to inject the PatchMyPC.log into Azure we need to start with onboarding the machine running PMPC Publishing Service by installing the Microsoft Monitoring agent and have it report to our Log Analytics Workspace. I presume you already have one, or you can get more information about creating one here Create a Log Analytics workspace in the Azure portal
If you have your PMPC Publishing service running in Azure, it would most likely already have been onboarded automatically. If not, you can always follow this guide for onboarding Azure VMs too. To onboard your machine you should start by going into your log analytics workspace and click on Advanced Settings -> Windows Servers.
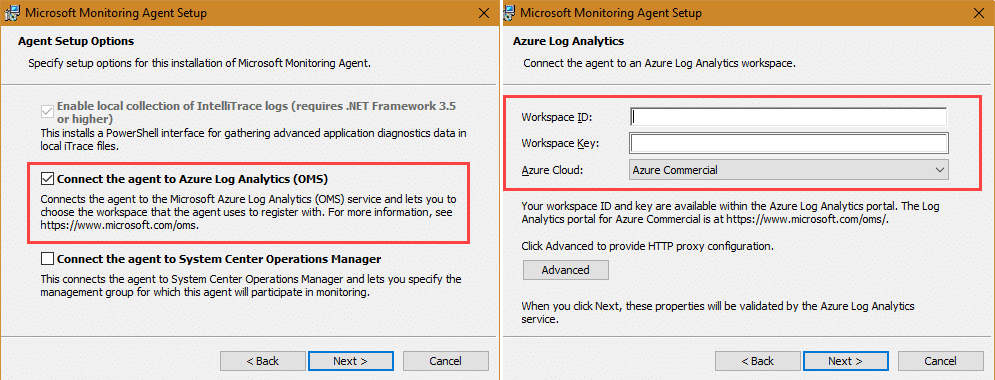
On this page we need to download the Windows Agent (64bit) to the Publishing Service machine, take a note of the WorkspaceID and the Primary Key of your workspace. This is used for onboarding the machine for log collection and connecting it to the correct log analytics workspace. When you have downloaded the agent, install it and add your configuration to the setup like this:
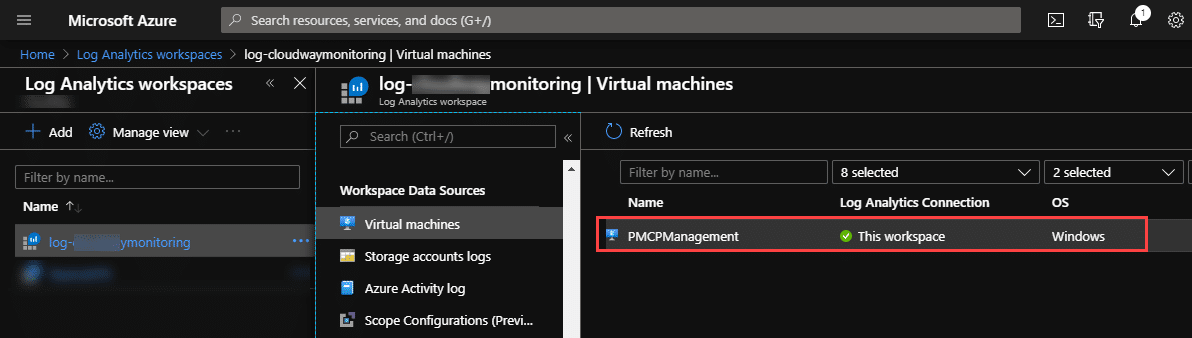
After install is done you should see your machine in portal under the Workspace Data Sources in your log analytics workspace:
Now we are ready to setup the custom log injection. Go back to Advanced Settings, and now go to Data -> Custom Log and click on Add
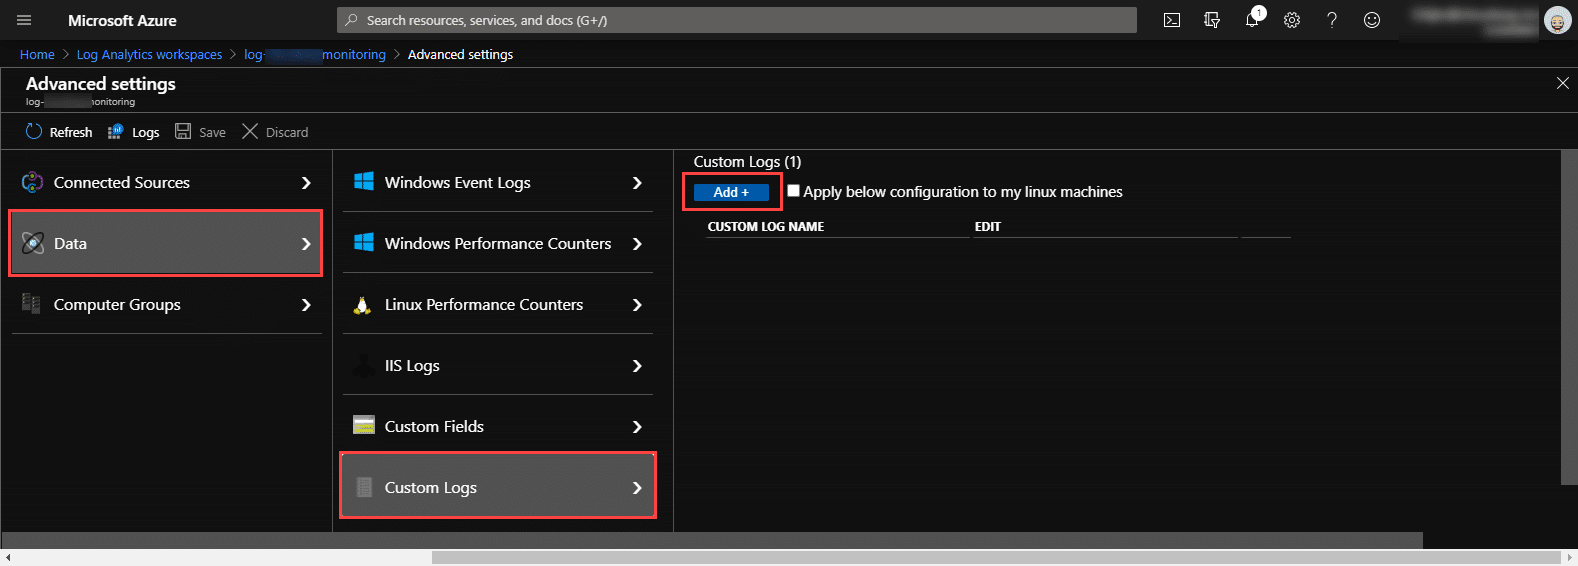
Next is a Wizard for adding a custom log to your workspace. Have a copy of your patchmypc.log logfile ready.
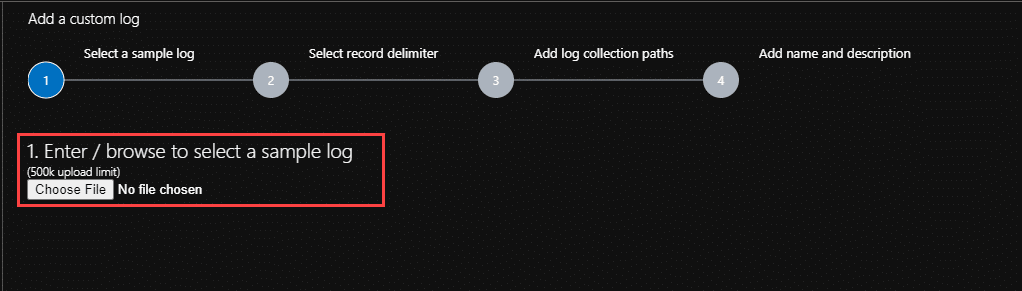
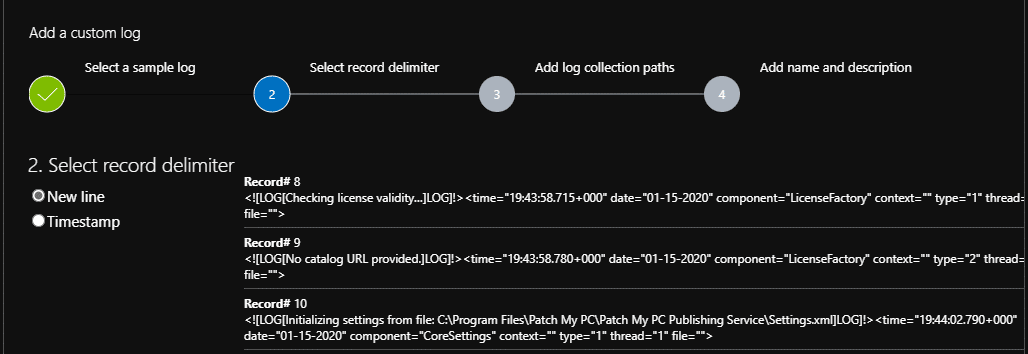
Click on Choose File and pick your samle patchmypc.log file and click next. As the log file from Patch My PC is not optimized for Log Analytics but rather CMTrace the best option is to simply choose New Line as record delimiter.
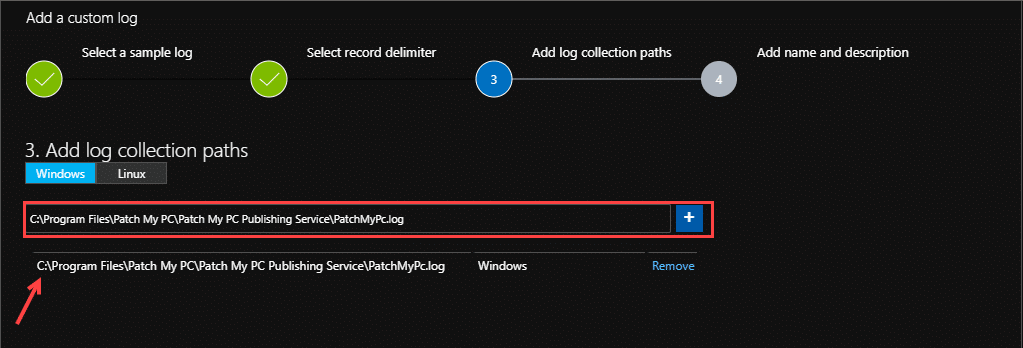
Click on Next – and define the path to the file LOCALLY on the machine running the Publishing Service and click on + to add it.
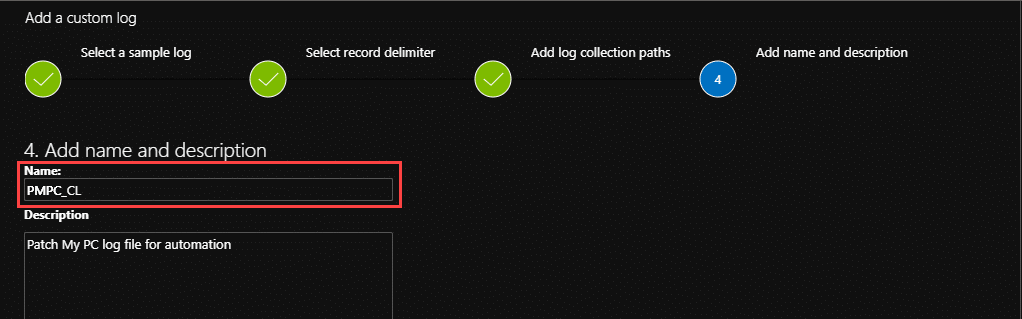
Add a name for our custom log and a description
(the _CL part of the name is mandatory for all customs logs)
Click on Done and Microsoft Monitor Agent will start forwarding all entries from patchmypc.log into your log analytics workspace. Be aware that the first injection might take some time depending on your log size, as it will forward the full log as its first step. After the initial import is done, the following log entries will be available in Log Analytics after a short delay. My experience is that this goes pretty fast (less than 10 minutes)
Azure Monitor and Kusto (KQL) query configuration
Building the KQL Query
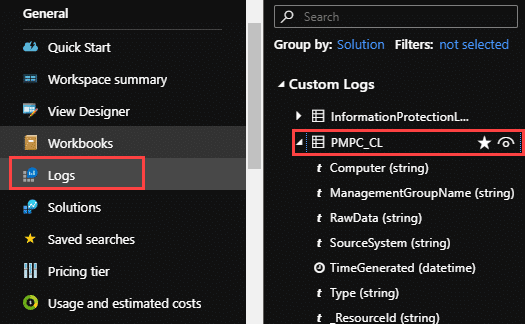
The first thing we do now, is to go into the Log Analytics Workspace we configured in our last step and click on Logs under General. You should see a option called Custom Logs on the rights side blade.
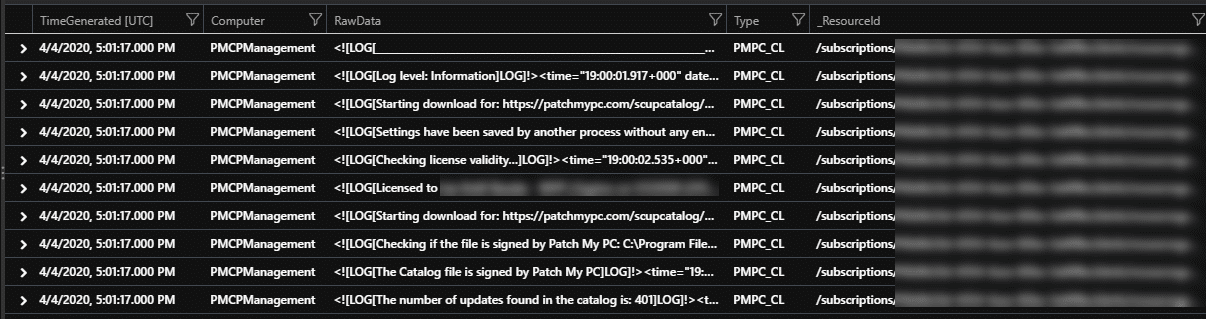
Click on the “View-Icon” beside the start and you should get a preview of your data. Click on See in query editor so we can start working on the KQL Query we need for our automation runbook. The first thing we will see is that the data contains some timestamps and then some raw data. The raw data is what we are interested in. What we are looking for in the logs is the actual updates published into our Intune tenant.
To get started with parsing that raw data, he first thing I do, is to remove the limit 10, add a time limit of 24 hours and parsing to our query like this:
PMPC_CL
| where TimeGenerated > ago(24h)
| parse kind=relaxed RawData with * '<![LOG[' Logdata ']LOG]!><time=' Logtime '" date=' Logdate '" component="' component 'context'*
No we can more easily see what we are looking for in this result:
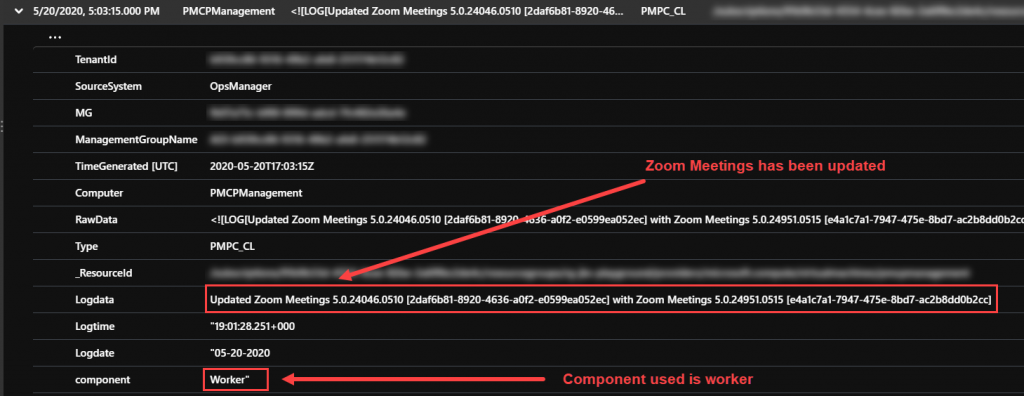
I am looking for the "Updated" string as this string contains the Intune App ID for both the original app and the updated app. Big thanks to Patch My PC for quickly responding to my UserVoice on this.
As the logs contains a lot more information that we do not need, we add a filter on top of your query so that it returns only what we are looking for. We know we are looking for if RawData contains the word Updated as that is the action we are looking for.- And we also narrow the search further with looking for the word Worker as the log lines that contains the Update information is done by the component Worker. To make sure that only the log entries we are looking for is returned I tested with searching through 3 weeks of data.
 PMPC_CL
| where TimeGenerated > ago(21d)
| where RawData contains "Worker" and RawData contains "Updated"
| parse kind=relaxed RawData with * '<![LOG[' Logdata ']LOG]!><time=' Logtime '" date=' Logdate '" component="' component 'context'*
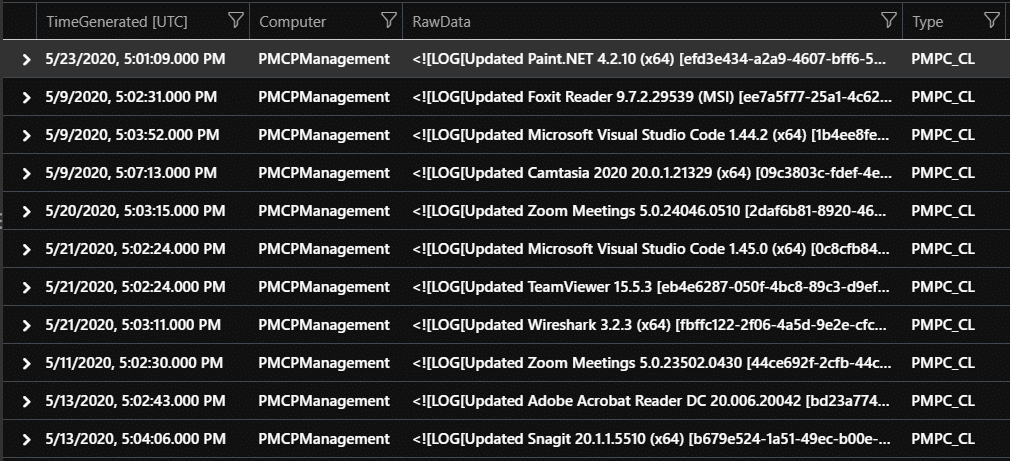
We have now verified that we only get exactly the lines from the log that is needed.
This brings us to the next level of parsing. We also need to parse the new Logdata entry to get out just the details we need for the Automation Runbook. We are looking for 4 pieces of information:
- Original App Version
- Original App ID
- Updated App Version
- Updated App ID
PMPC_CL
| where TimeGenerated > ago(24h)
| where RawData contains "Worker" and RawData contains "Updated"
| parse kind=relaxed RawData with * '<![LOG[' Logdata ']LOG]!><time=' Logtime '" date=' Logdate '" component="' component 'context'*
| parse kind=relaxed Logdata with * 'Updated ' OrgAppVersion ' [' OrgAppID '] with ' UpdatedAppVersion ' [' UpdatedAppID ']'*
Now we can see that we have entries containing what we are looking for:
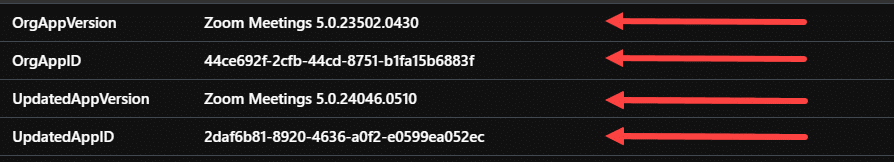
So we have the entries, now lets project only those entries and skip the rest.
PMPC_CL
| where TimeGenerated > ago(24h)
| where RawData contains "Worker" and RawData contains "Updating" and RawData  !contains "BaseInstallOnly" and RawData  !contains "Updating assignments for"
| parse kind=relaxed RawData with * '<![LOG[' Logdata ']LOG]!><time=' Logtime '" date=' Logdate '" component="' component 'context'*
| parse kind=relaxed Logdata with * 'Updating ' OrgAppVersion ' [' OrgAppID '] with ' UpdatedAppVersion ' [' UpdatedAppID ']'*
| project OrgAppVersion, OrgAppID, UpdatedAppVersion , UpdatedAppID
The result we have now only shows exactly the data we need to move forward. One entry for each app that is updated with the original app-version and app id and the updated app’s version and app id.
Now that we have our query, lets save it by clicking Save on the top bar. The first log injection will contain all logs up until now. So I recommend you wait 24 hours before you setup your Azure Monitor to avoid having alerts for all your previous updates in Azure Monitor. We are creating a new Alert Rule in Azure monitor by simply clicking New Alert Rule on the top bar.
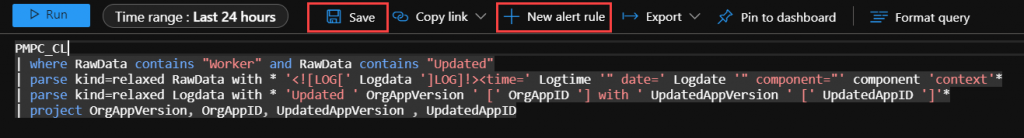
If you look at the image above, we have also removed the time constraint stamp from the query, as that should be either controlled by choosing time range in the top bar here, and for Azure Monitor we will define it on the alert rule it self.
Azure Monitor Setup
Go ahead and click on New Alert Rule. The Create rule blades opens up and we can see it is connected to our log resource and resource group. We should also see a red exclamation mark on the condition of the alert rule. Click on that.
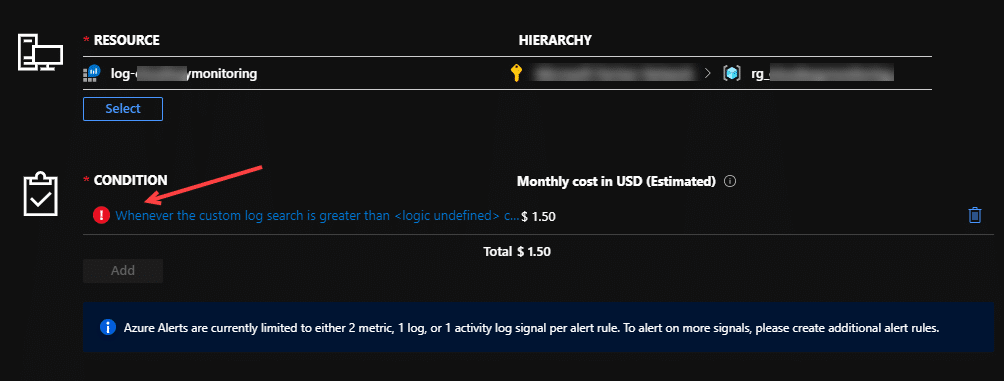
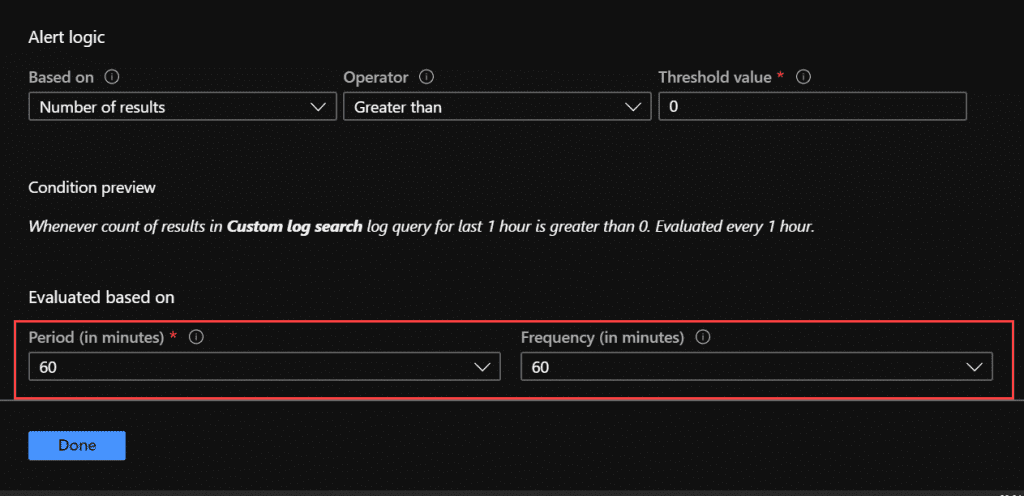
Now we get into configuring our signal logic. First thing we see here is that the Search query is moved over from Log Analytics so we do not have to touch that. Just make sure you have removed the timegenerated line so that it does not put a limit on your results. What we need to do in here, is to setup Alert Logic with threshold and Evaluation periods. I recommend you run this once per 60 minutes, this will cater for manual syncs on the PMPC Publishing service in addition to our schedule. But we can define what we like in here. Just make sure the evaluation period and the frequency is the same so we don’t get “double-alerted” on the same patch as that will brake our logic. Also set the Number of result to Greater than threshold value to zero so we catch every update that comes along.
Click on done and your Azure Monitor is ready to create alerts on this. We have to give it a name and choose a Severity before we can create the alert rule. I recommend you set the severity to low (like 4), and we will get back to the Action Group soon. From this point forward Azure Monitor will create a alert each time there is a new update delivered from Patch My PC into our Intune Environment. This is what we are using to kick of the IntuneWin32AppRemedy runbook.
Create and configure the Logic App in Azure
The action on our alert above is going to be an Azure Logic App. This logic app is going to get triggered by the Azure Monitor alert, do the same log analytics query to get the parameters needed for the IntuneWin32AppRemedy Runbook to run. The logic app has some requirements
- Add Log Analytics permissions to the Azure AD App Registration we created for the IntuneWin32App Remedy runbook.
- The IntuneWin32AppRemedy Runbook must be published and ready
Service Principal (App) Permissions for Log Analytics
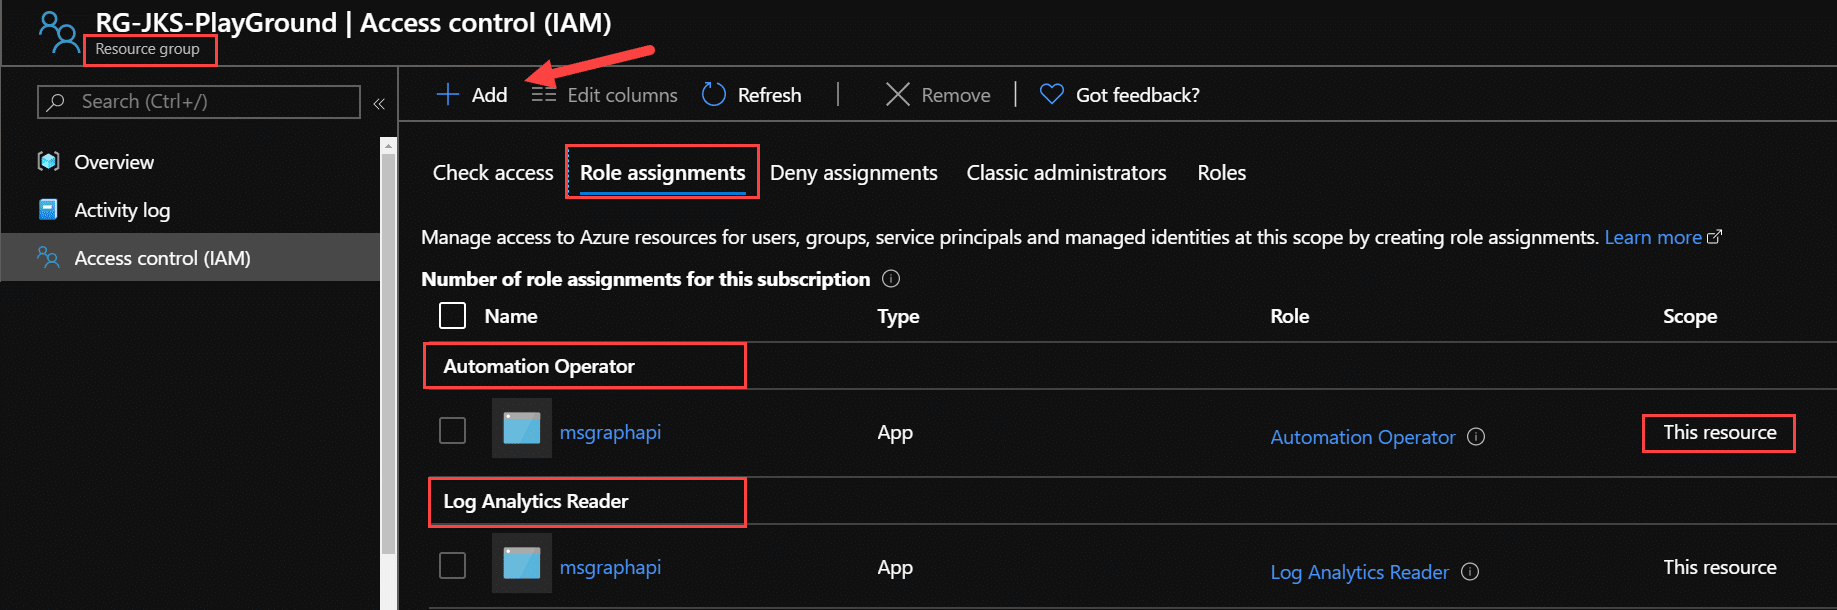
For the Azure AD Application we created to be allowed to query our log analytics workspace we have to give it permissions to do so. Following least privileges guidelines I have tried to give the app as little permissions as possible to work. For the Logic App to work, we have to have assign the Azure AD Application the following roles on the Resource Group Level.
- Log Analytics Reader
- Automation Operator
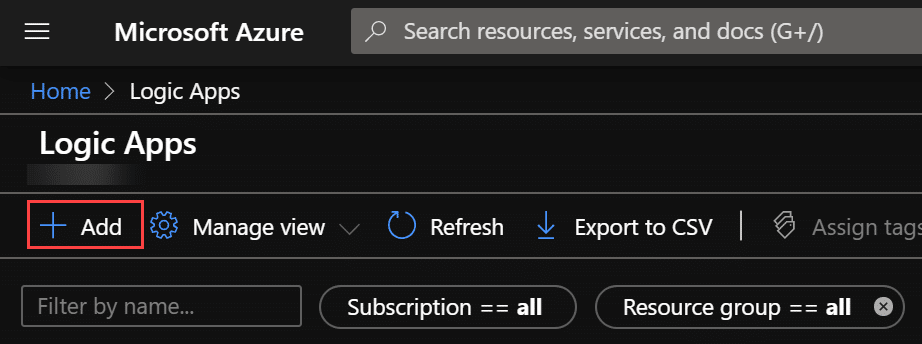
Create the Logic App
In Azure go to Logic Apps and Add a new Logic App.
In the create window, choose the same subscription and resource group as the log analytics workspace we created in the first step. Also give the app a descriptive name so you can see what logic app is used for what if you have more than one.
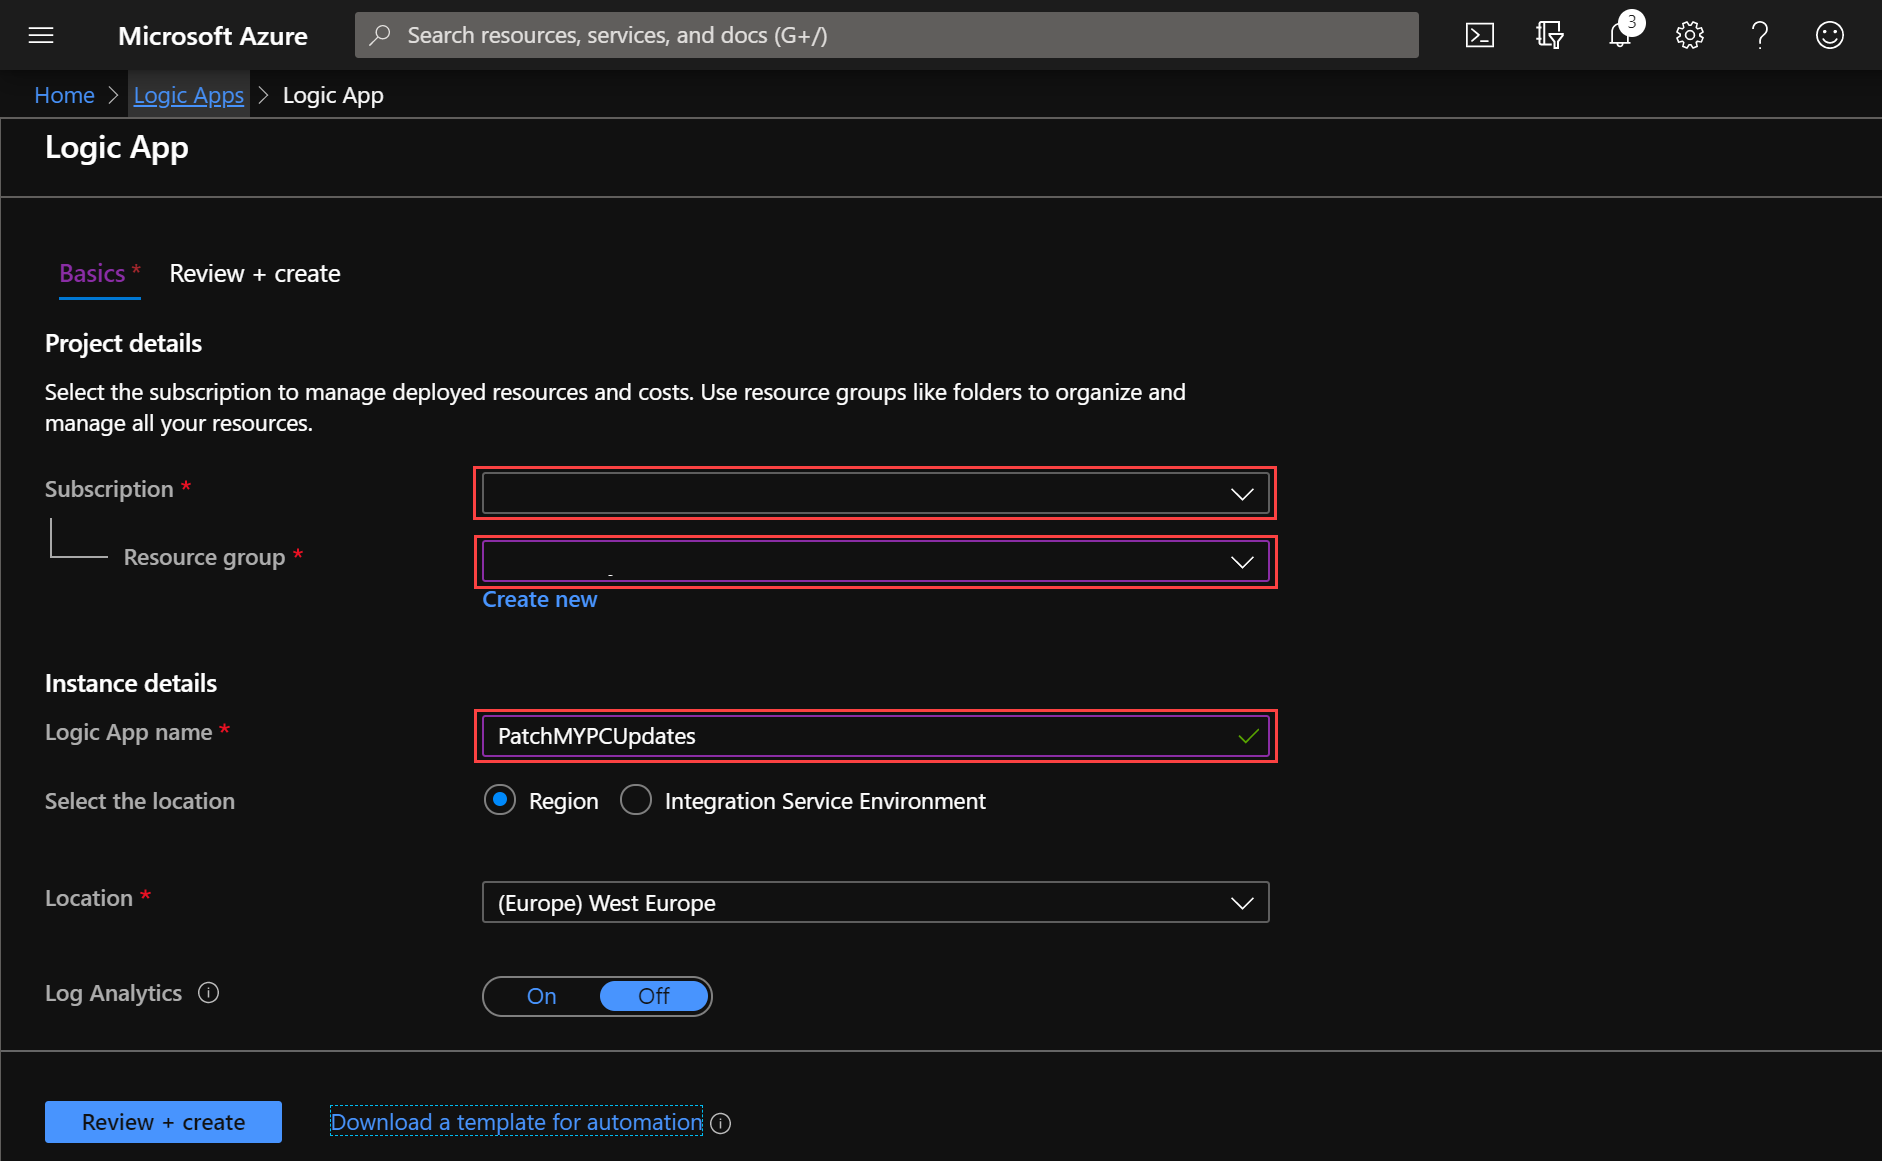
Click on Review and Create and allow the validation to finish before you click on Create. When the deployment is ready you will be redirected to a new page that say your deployment is ready. Click on Go to Resource button to get started.

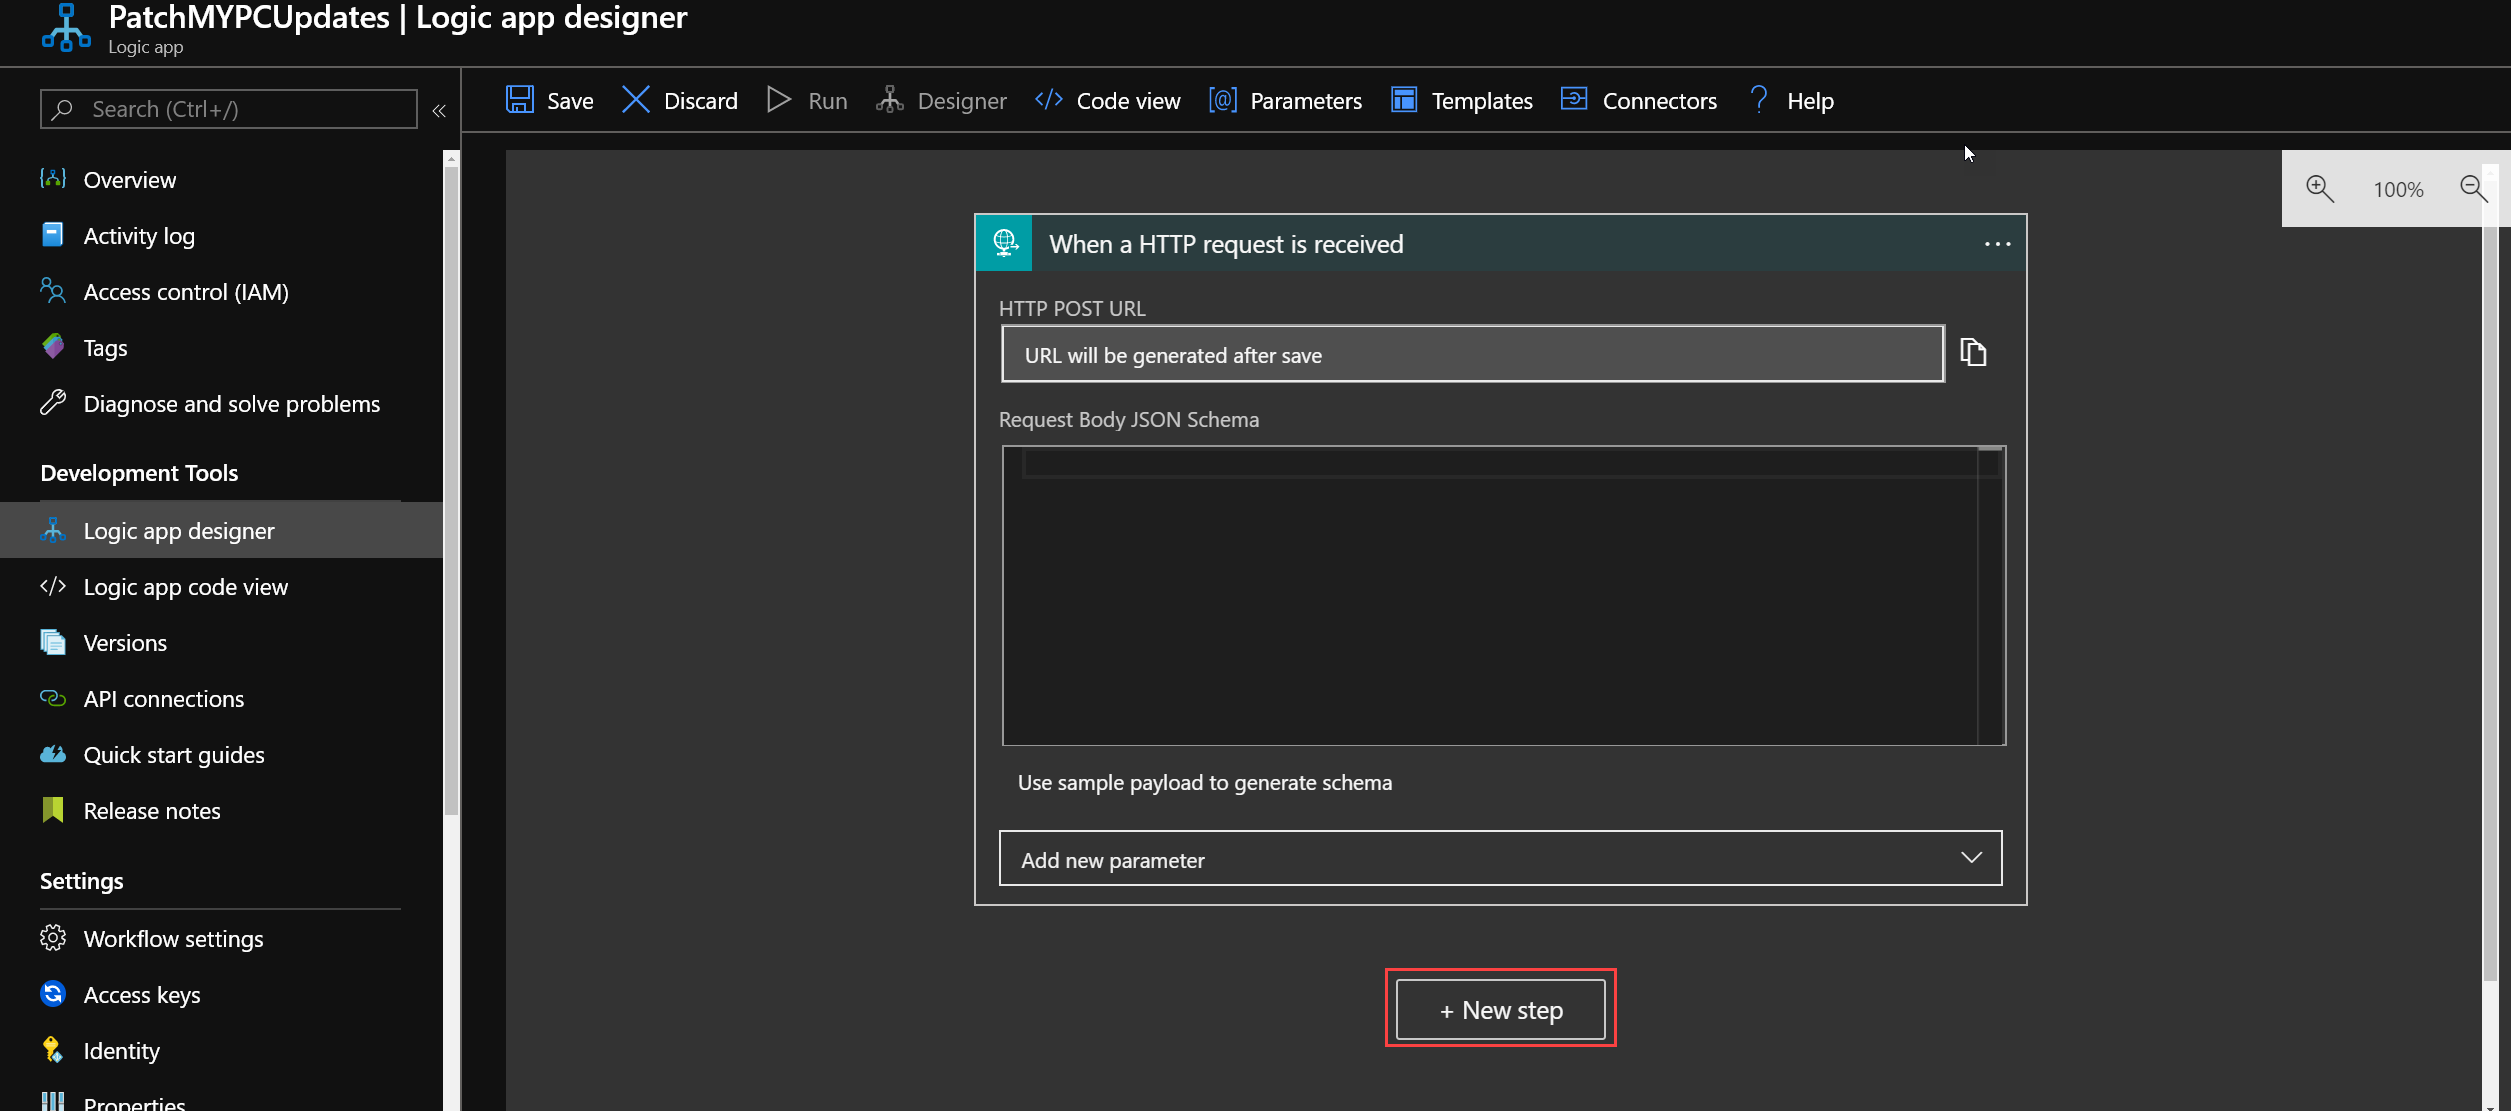
We are now redirected into the Logic App Designer. Choose When a HTTP Request is received as trigger for the app.

The app designer will now open and we can add a new step in the app following the HTTP Request trigger. The HTTP request trigger will come from Azure Monitor when we have finished all components.
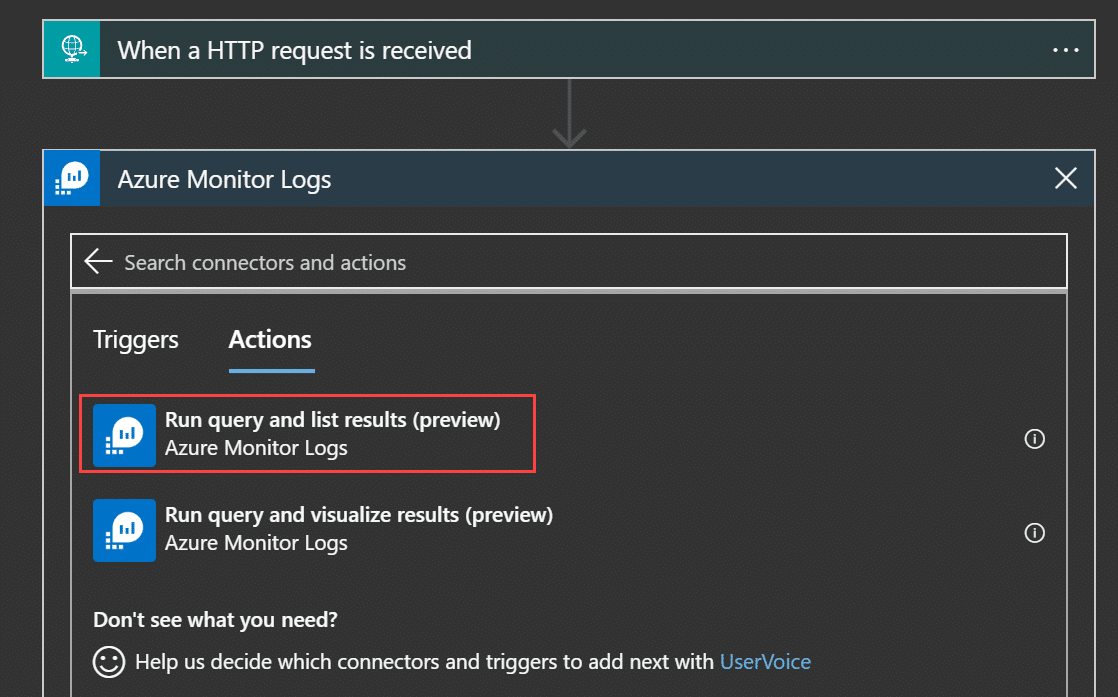
In the new step “wizard”, search for Action Azure Monitor Logs and choose Run query and list results
In the connection windows, do not login in with a user, but click on Connect with Service Principal. This is what allows us to use our Azure AD App (Service Principal) that we gave permissions to earlier.
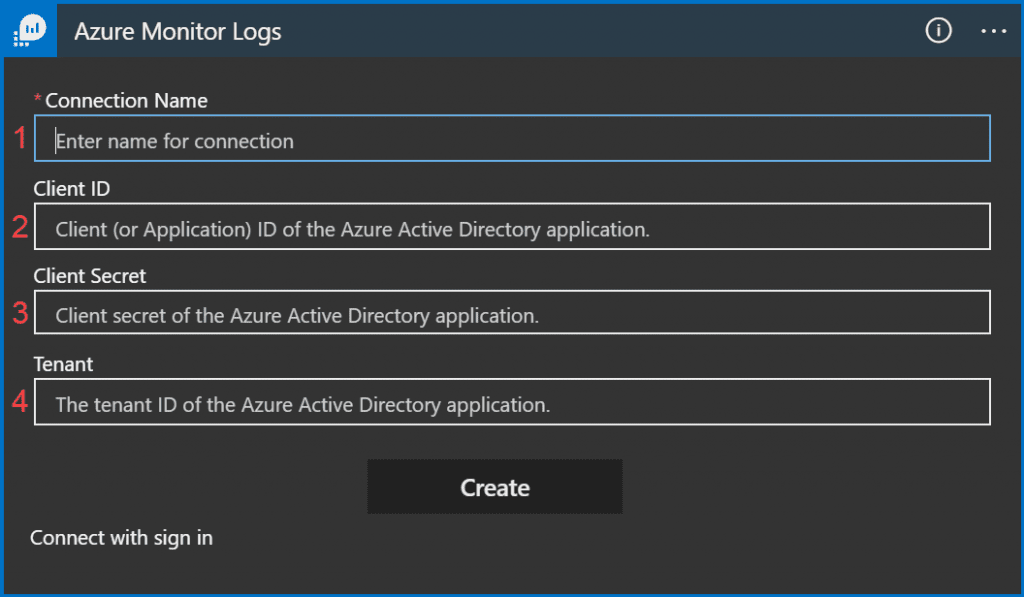
To configure this connection we need the following information from our Azure AD App
- Give the API Connection a name – ex. PatchMYPCLogConnection
- Client ID for the Azure AD App
- Client Secret for the Azure AD App
- The Tenant ID of your Azure Active Directory
After you have entered this information click on Create. If you have assigned the correct permissions you will have the option of selecting the log workspace you have configured earlier on.
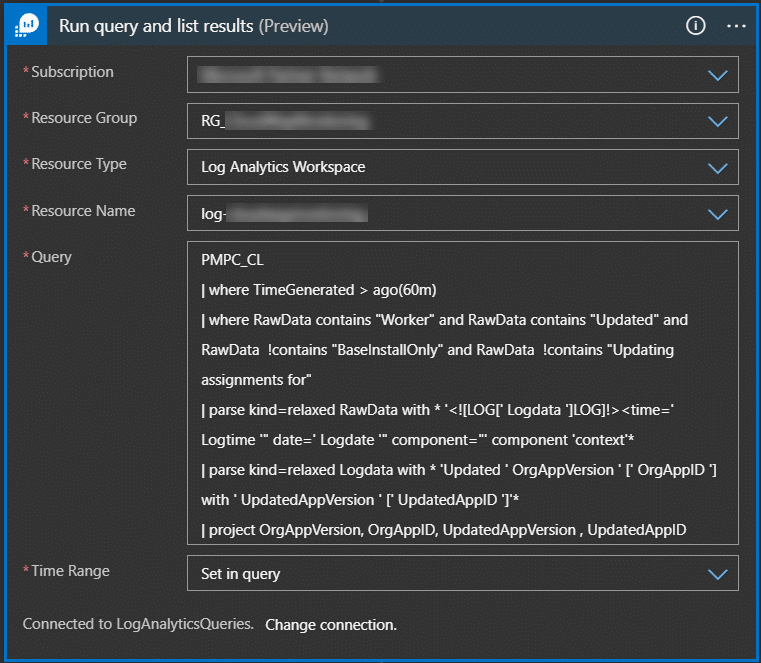
In the Query field we are going to use the same query as we have configured in Azure Monitor with some minor changes. We now have to match the timegenerated in our query here with the frequency we defined in the Azure Monitor frequency. If your frequency is once per hour, the query here must be for the logs generated the last hour only. I personally prefer to define the time range in the query itself.
(For testing only, you can set a much longer interval to see that the query works.)
PMPC_CL
| where TimeGenerated > ago(1h)
| where RawData contains "Worker" and RawData contains "Updated"
| parse kind=relaxed RawData with * '<![LOG[' Logdata ']LOG]!><time=' Logtime '" date=' Logdate '" component="' component 'context'*
| parse kind=relaxed Logdata with * 'Updated ' OrgAppVersion ' [' OrgAppID '] with ' UpdatedAppVersion ' [' UpdatedAppID ']'*
| project OrgAppVersion, OrgAppID, UpdatedAppVersion , UpdatedAppID
Click on New Step and search for Azure Automation

Now again we will be asked to logon or Connect with Service Principal. Choose Connect with Service Principal and enter the same information as before (using the same app that we have giving permissions too)

After creating the connection to Azure Automation select the Subscription, Resource Group, Automation Account first. Then click on Add new parameter and select Runbook Name, pick your runbook. The connection will now read the runbook and the parameters defined as input to the runbook and present these in the UI for selection.

Pick the first parameter from our Log Analytics query in the previous step in the runbook. That wil automatically change this step to a For each step.

Reopen the Create Job part and pick the rest of the variables that are needed for the runbook. Makre sure each variable you choose matches with the name.
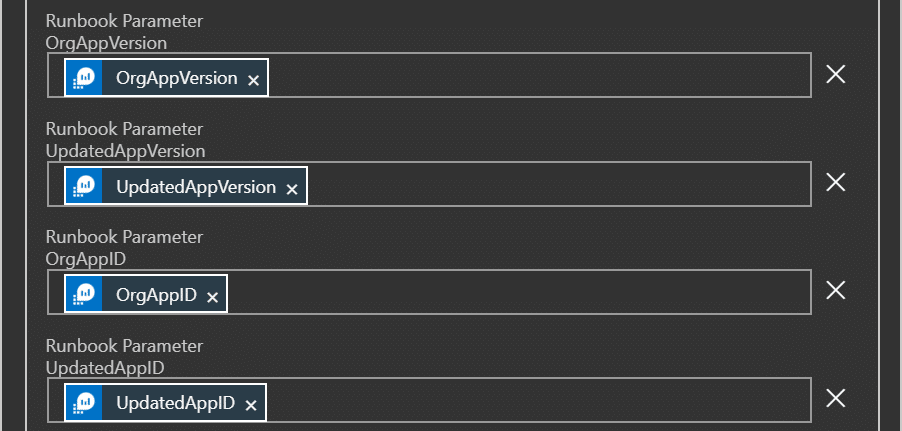
Click on Save and your Logic App is ready for use and are already integrated with the Automation Runbook.
Creating the Action in Azure Monitor
The Logic App is setup with a HTTP request as trigger. We are now going to configure the alert we made earlier to call this Logic App. This will combine all the components in this integration to a complete solution.
In Azure go to Monitor – Alerts and click on Manage Actions
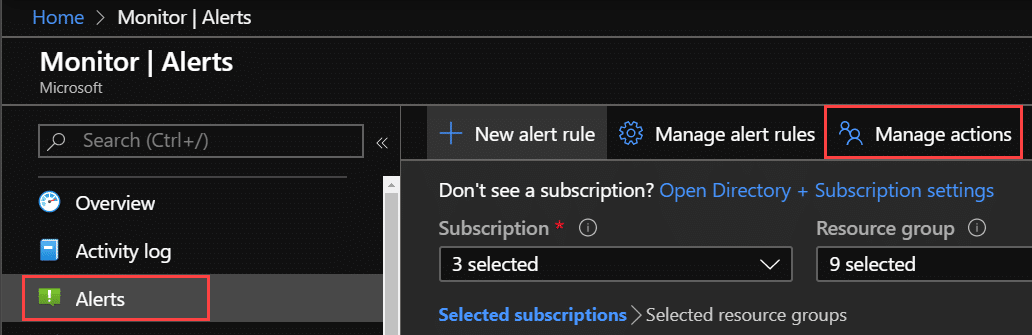
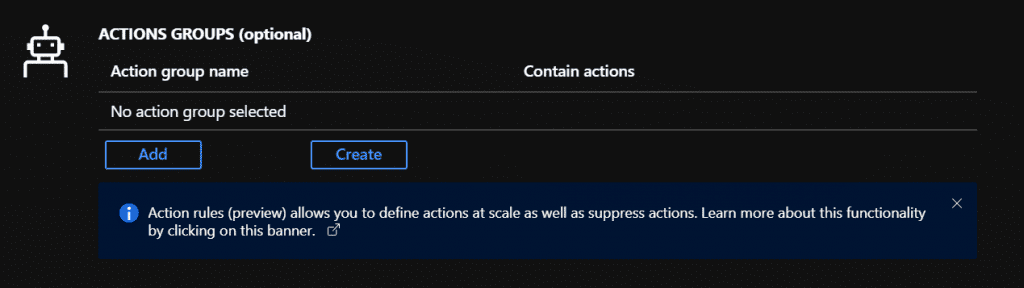
Click on Add Action group.
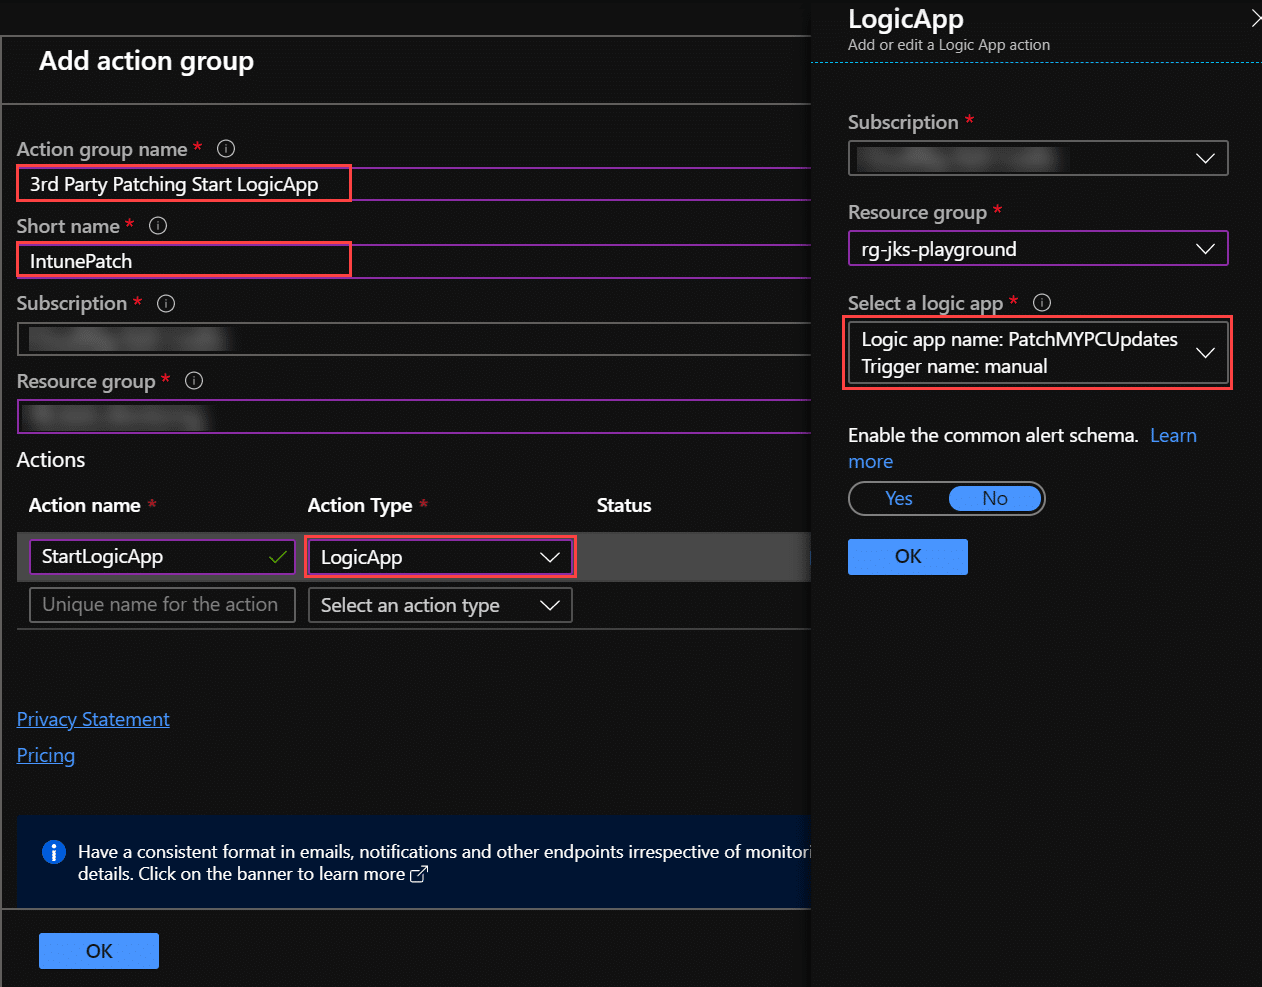
Click OK 2 times and you should have your new Action Group in the list
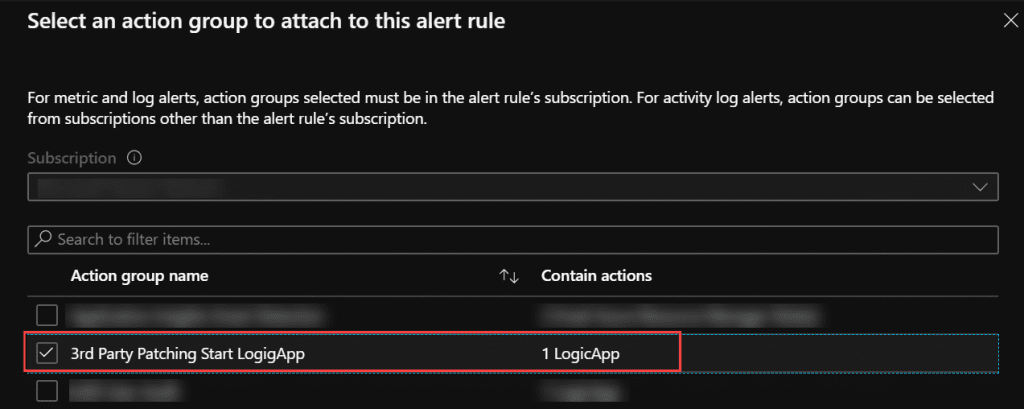
Now go back to the Alert we created earlier and open it up. Scroll down to Action Groups and click on Add
Pick your Action Group and save the alert.
The integration of all the components are now in place and you can sit back and wait for the next application update to arrive.
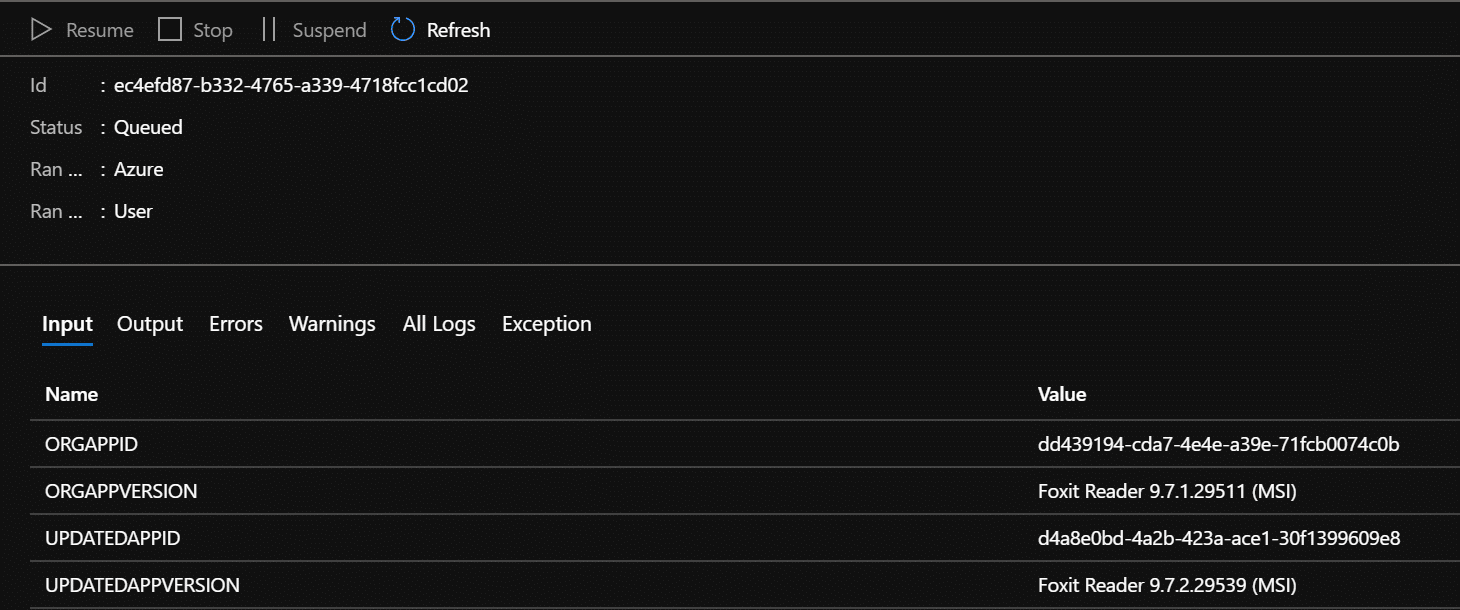
Runbook input example from a run in Azure Automation


Add comment