Back in July last year we released a community version of our Windows Update Compliance dashboard, a KQL driven workbook that helped you visualise Microsoft Update Compliance data. Since then there have been a number of improvements both in the type of data and a version 2 schema update.
The good news is we have a new workbook for you, but some light reading first as to some of the changes at Microsoft’s end;
Microsoft Update Compliance Onboarding Change
Back on August 17th Microsoft also made a change to the onboarding process for Update Compliance, moving the onboarding out to the Microsoft 365 Administrative Center. The new onboarding process is straight forward, where we simply select the Azure subscription and log analytics workspace to be used for storage of your UC logs;
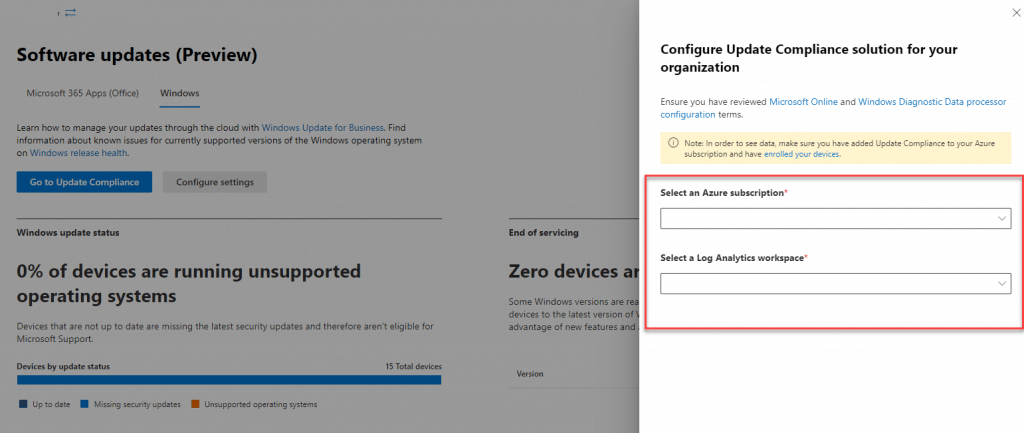
Personally I’m not quite convinced by the location of this onboarding experience at present, as I would prefer to see this in the Endpoint Manager Admin Center
This new onboarding process removes the requirement to push out a commercial ID, something which many admins have had frustration over due to the fact they still need to publish this value through OMA-URI in order to support Windows Pro licensed machines. This was due to the ADMX backed settings catalog policy only being applicable to Enterprise and Education editions.
Microsoft’s Own Native Workbook
Something that we also saw appear with the new onboarding experience, was an Update Compliance workbook from Microsoft. Located in the Monitor | Workbooks section of the Azure portal UI, the workbook offers quick oversights as to the health of your devices;
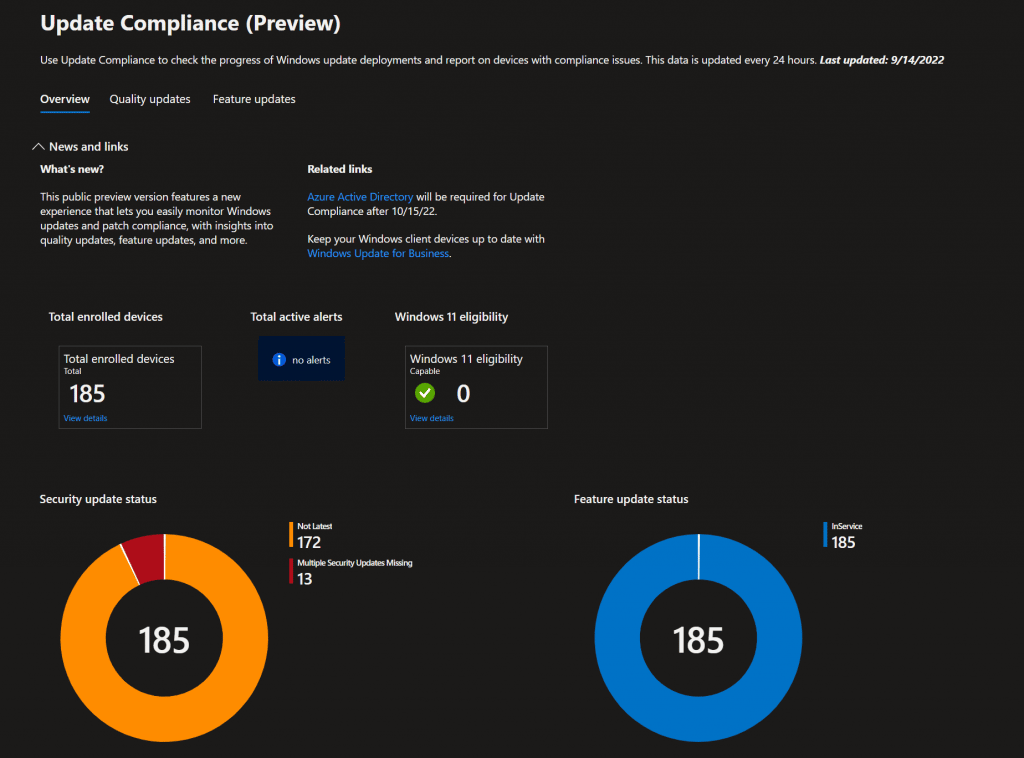
Its great to see Microsoft is committing to this format of report delivery, as this can only serve to benefit everyone in the community!
Windows Update Compliance Dashboard V8.0
Taking onboard all of the changes since our last community edition, along with elements that we have been adding working with clients, @jankeskanke, @sandy_tsang, and I are proud to release version 8.0 of the Windows Update Compliance Dashboard.
The dashboard has been massively overhauled to display items such as;
- Trending update compliance over time
- Windows Update for Business issues
- Feature update trends
- Delivery optimization details
- Windows 11 readiness
- Third-party application information
Below I am going to step through the individual tabs and elements of the dashboard, please note that in some cases some of the reports are not only dependent on the Update Compliance logs, but also leverage the Intune diagnostic logs, and custom hardware and application inventory logs gathered through PowerShell / ingested through a function app (Securing Intune Enhanced Inventory with Azure Function – MSEndpointMgr).
Summary Page
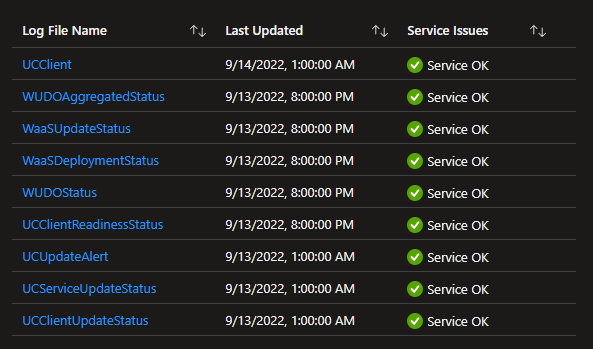
The summary page is designed to offer you a at a glance overview of your entire environment. At the top right of the page the Microsoft log timestamps are displayed, Logs older than 3 days old will be highlighted with a service issue alert, otherwise they are considered to be up to date;
The quality update patch trend shows you devices which are fully patched, pending patches, or missing multiple patches. As you can see from the screenshot below, the trend will show a decline in compliance once per month (patch Tuesday) and an improvement in compliance as per your defined update rings;

The next graph shows compliance against particular KB updates over time, where you will see declining KB installations over time due to CU rollouts and supersedence;

The next set of graphs show you items such as patch installation states, compliance states, client activity, current Windows builds, and target builds;
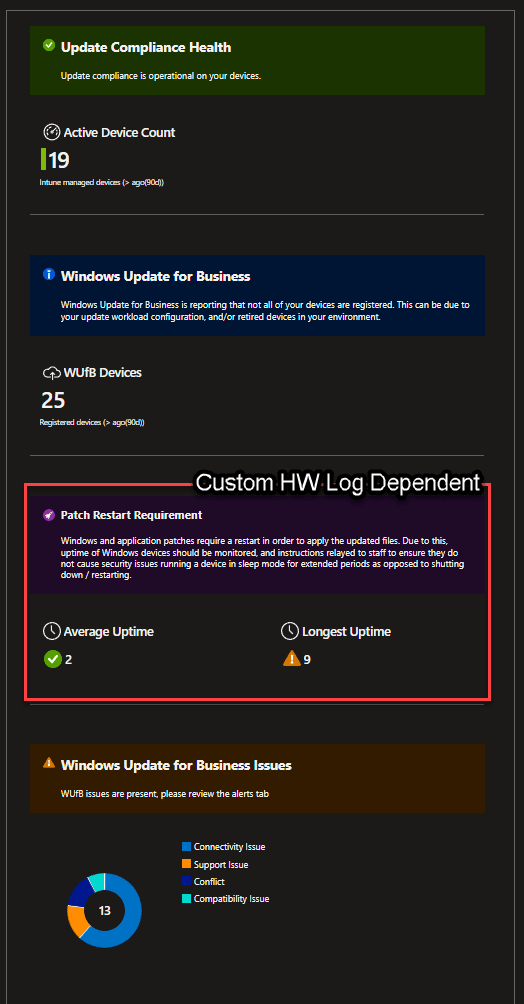
On the left side of the summary tab you can see key information about devices showing in the UC logs, issues being reported from Windows Update for Business for those devices, and optionally information on restart activity from those devices.
Quality Update History
The quality update history tab provides you with a 0-30, 60-90, 90+ day approach to reporting on induvial KB compliance. This tab has been updated to now include links to the individual KB’s, so anyone reviewing the dashboard can get a quick overview of the security issues being resolved;

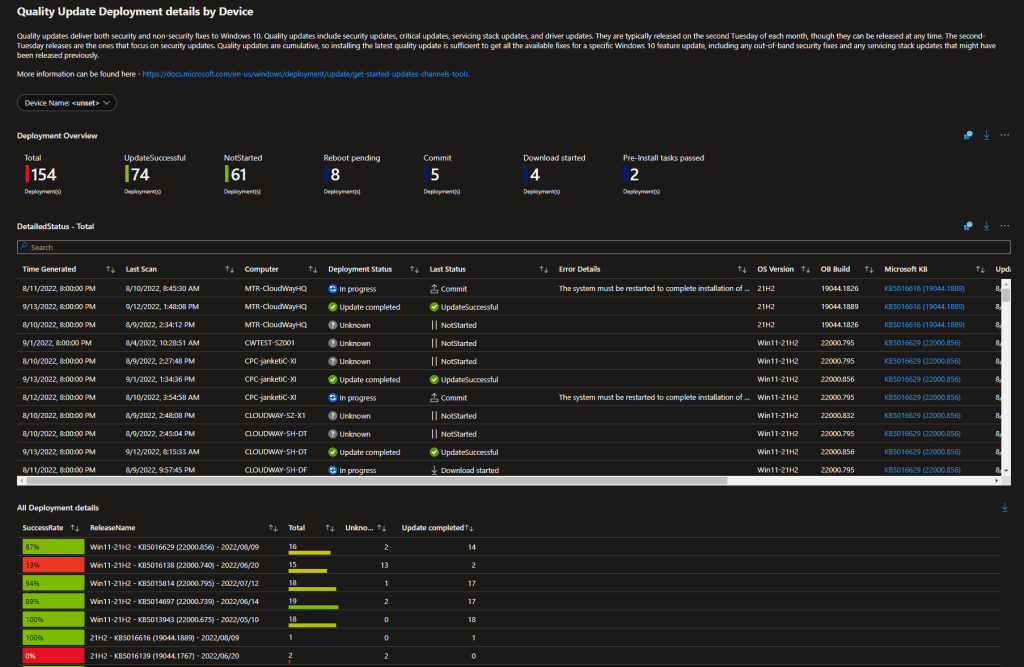
Quality Update Deployment – By Device
On this tab, the admin can get a full overview of updates being applied to specific devices, by default though it will show all devices;
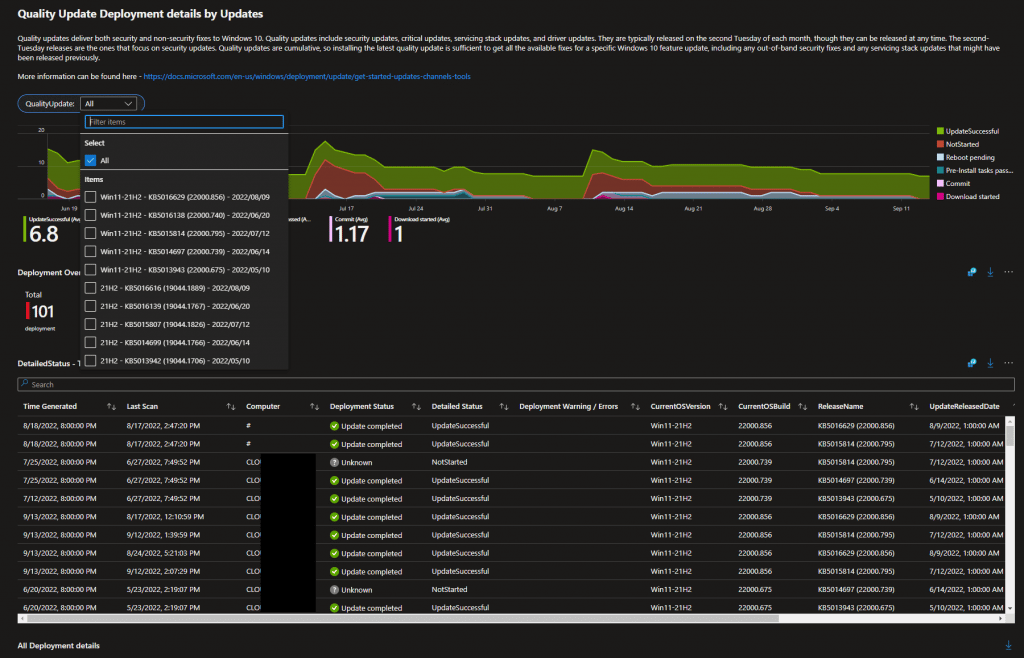
Quality Update Deployment – By Update
On this tab, just like you had the ability to filter based on a specific device on the previous tab, here you can filter based on the individual updates, selecting multiple, one or all;
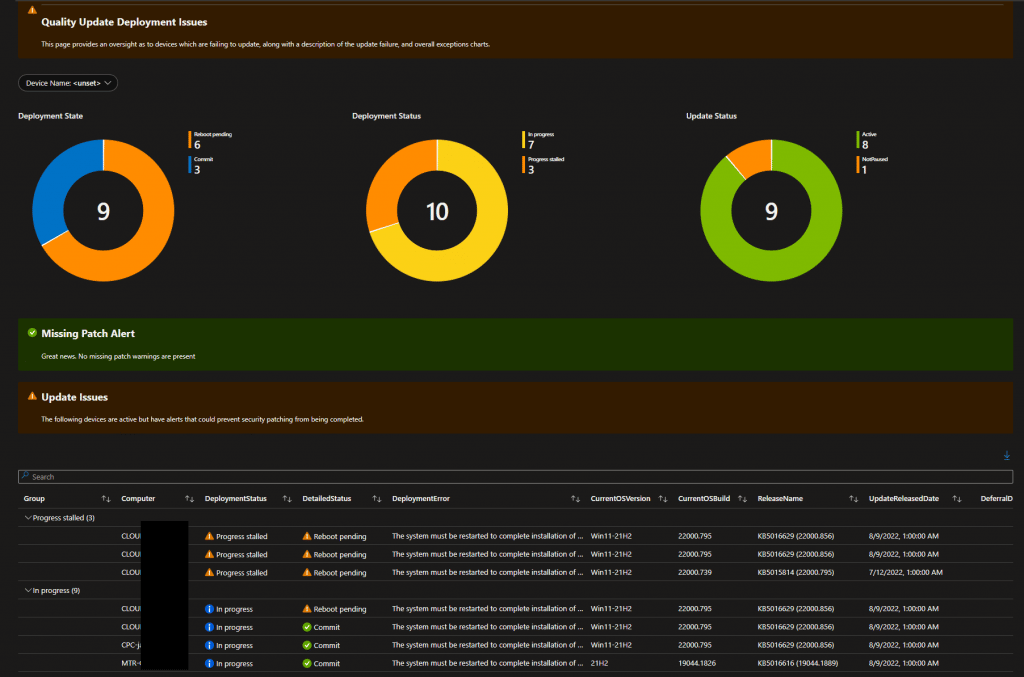
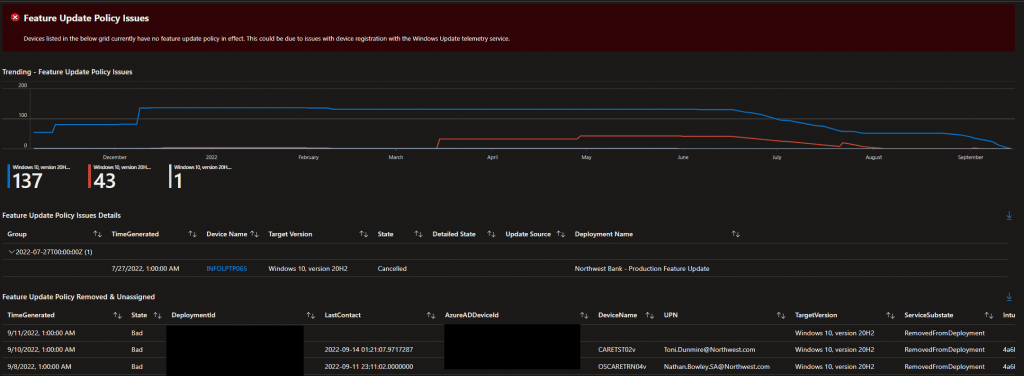
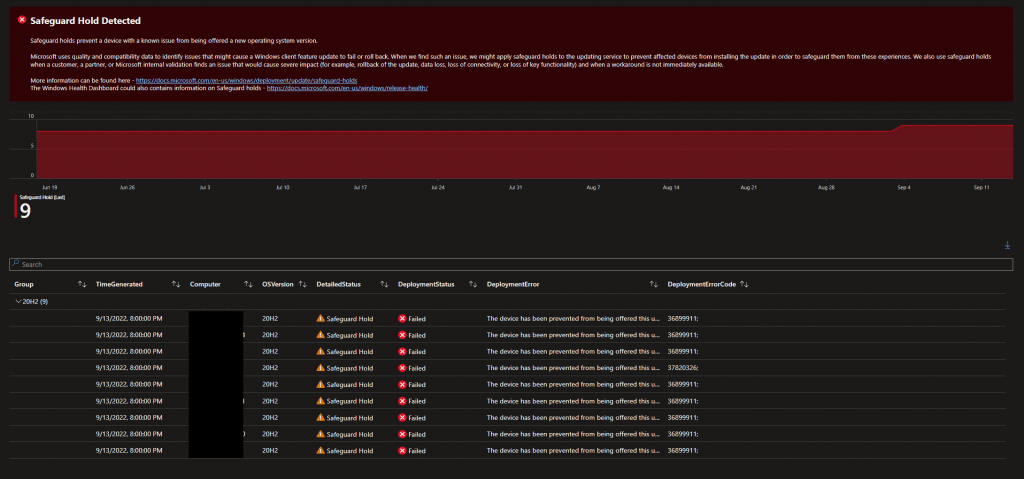
Update Issues
On this tab all blocking issues, including information such as updates pending restarts, compatibility issues, and safeguard holds are displayed;

Delivery Optimization
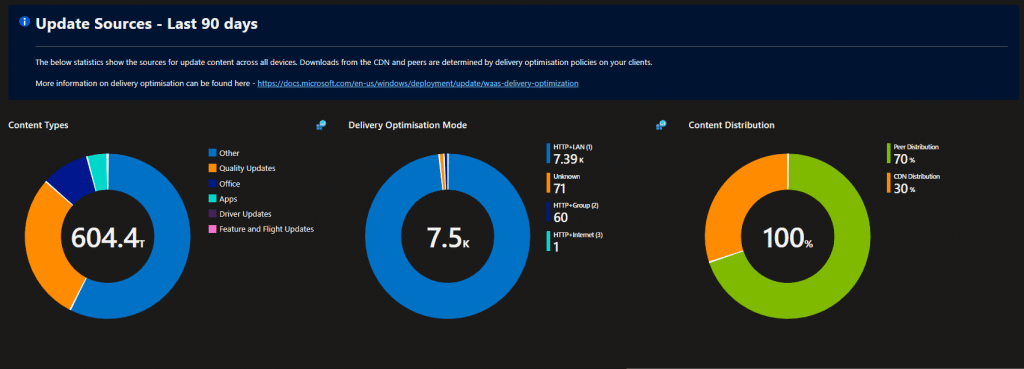
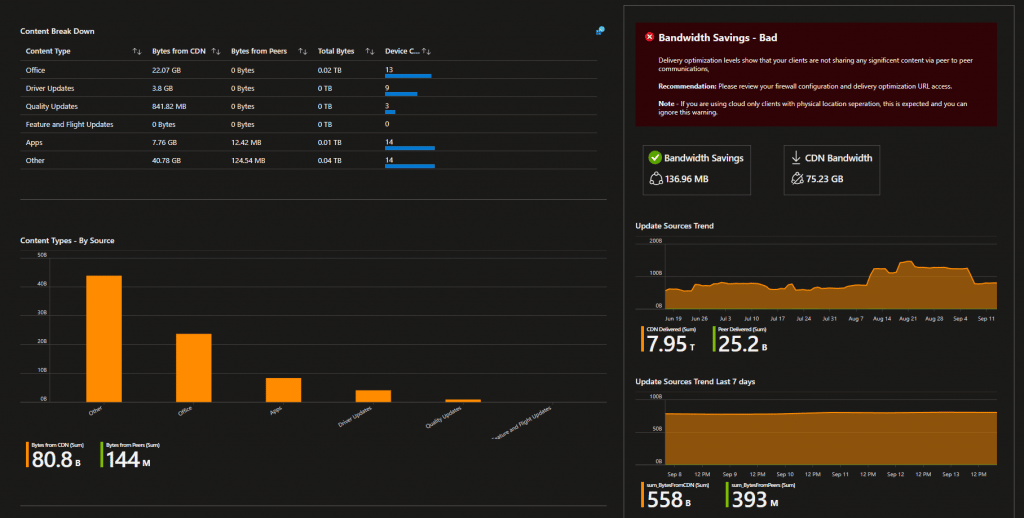
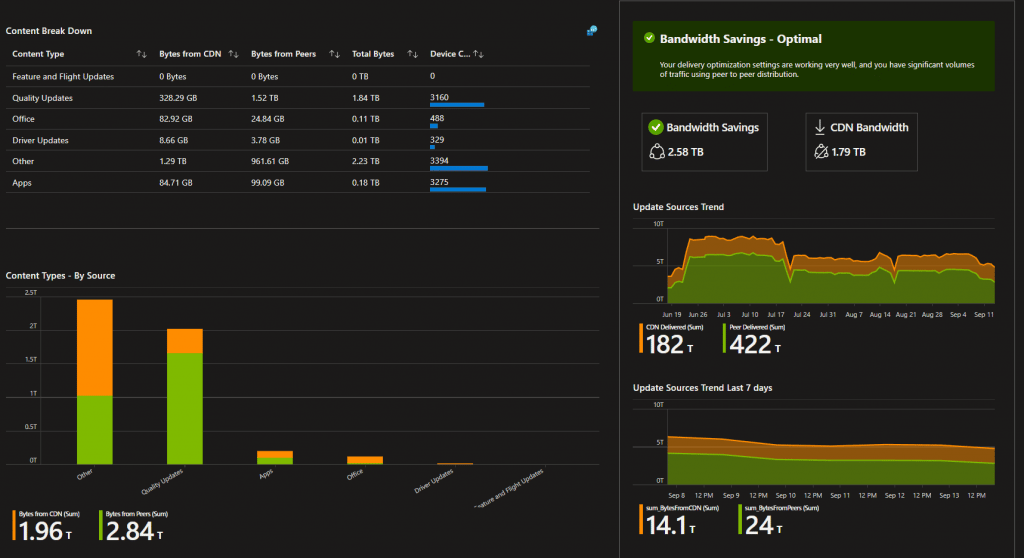
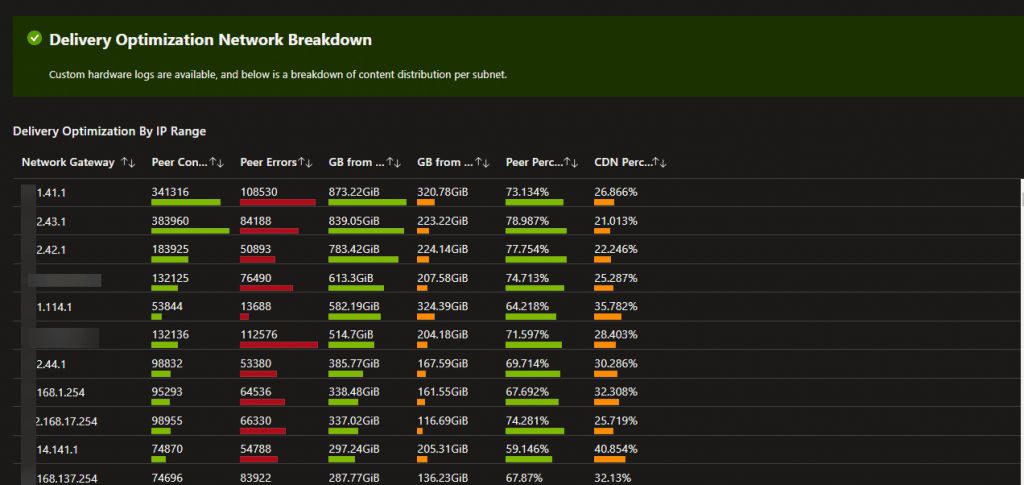
Knowing if your clients are using DO correctly is vital, on this tab you can see an overview of your DO state, with a ranked notification advising you if your DO states are Optimal, Good, Poor, or Bad. For those of you with custom hardware logs, you can also see DO traffic per subnet;

Feature Updates
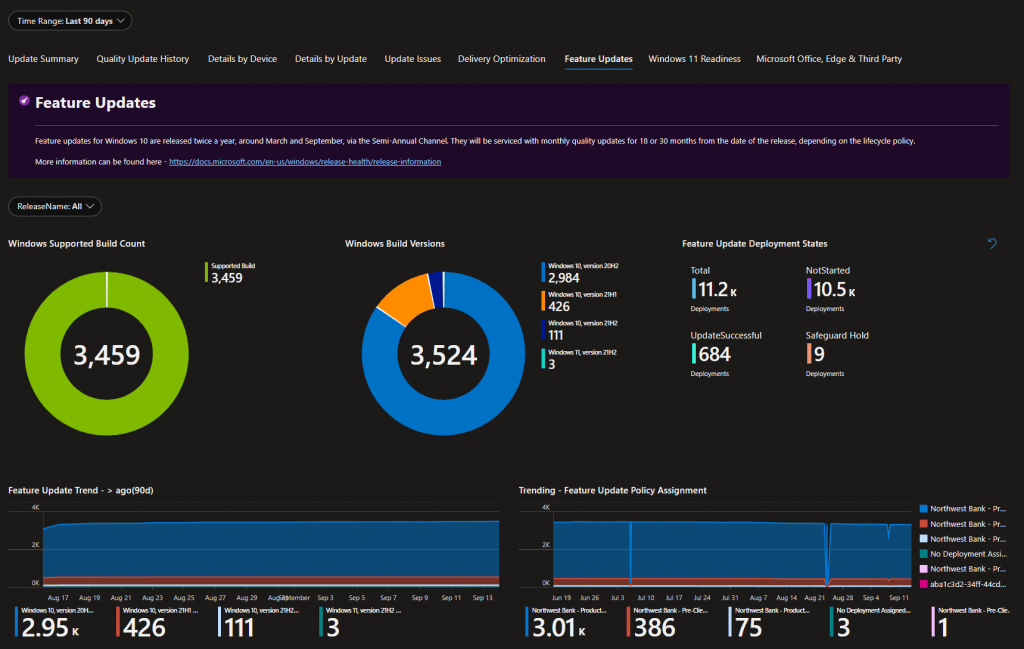
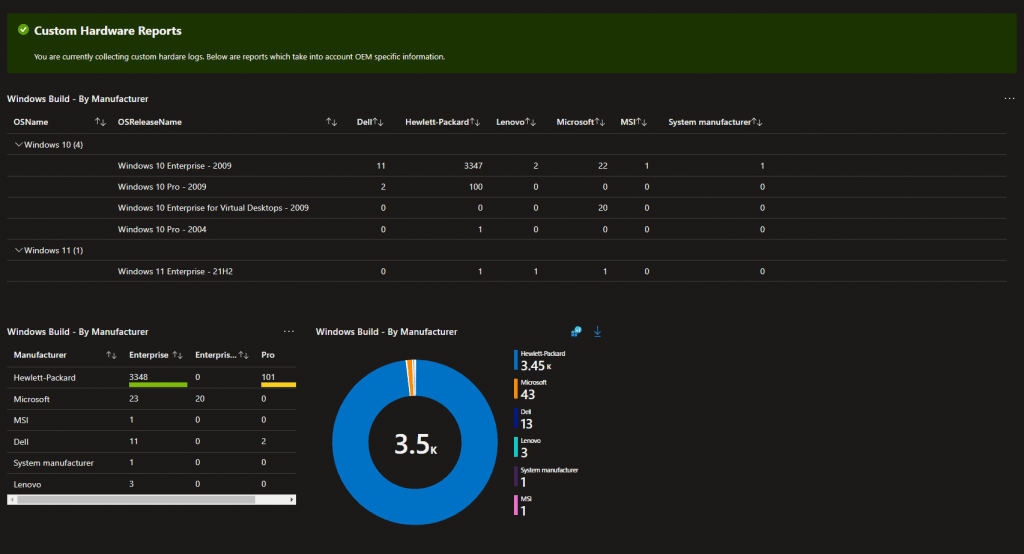
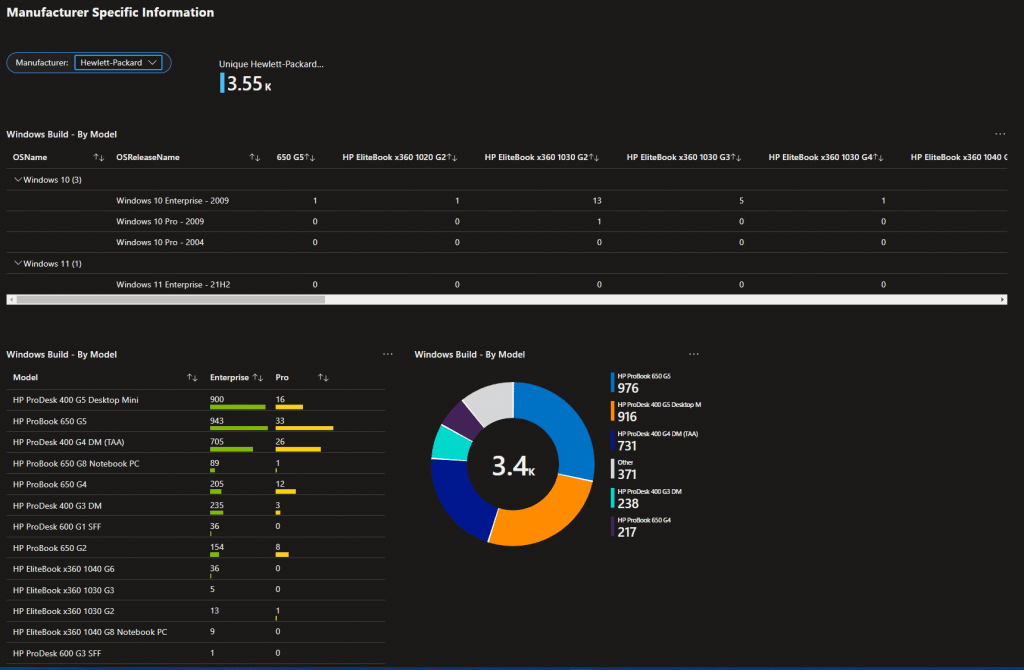
On the feature update tab, you can see wealth of information showing the progress of your devices moving to new builds, overall counts per build, and with custom hardware reports available you can also see a breakdown of manufacturers and models per Windows build;
Windows 11 Readiness
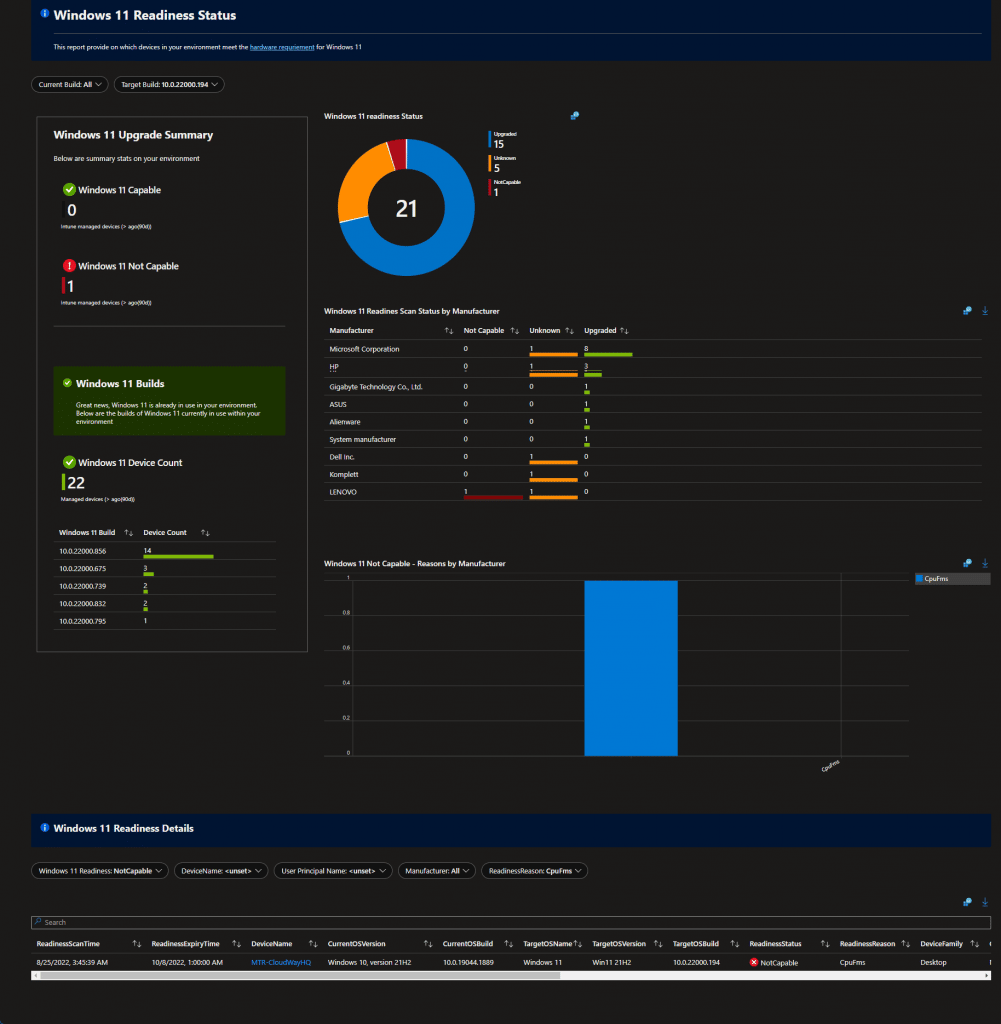
This self explanatory tab provides you with an overview on how many devices in your estate are capable of running Microsoft’s latest client OS;
Microsoft Office, Edge & Third Party
Finally on the last tab we have information on applications within your environment. Please note that information on this tab requires custom application collection.
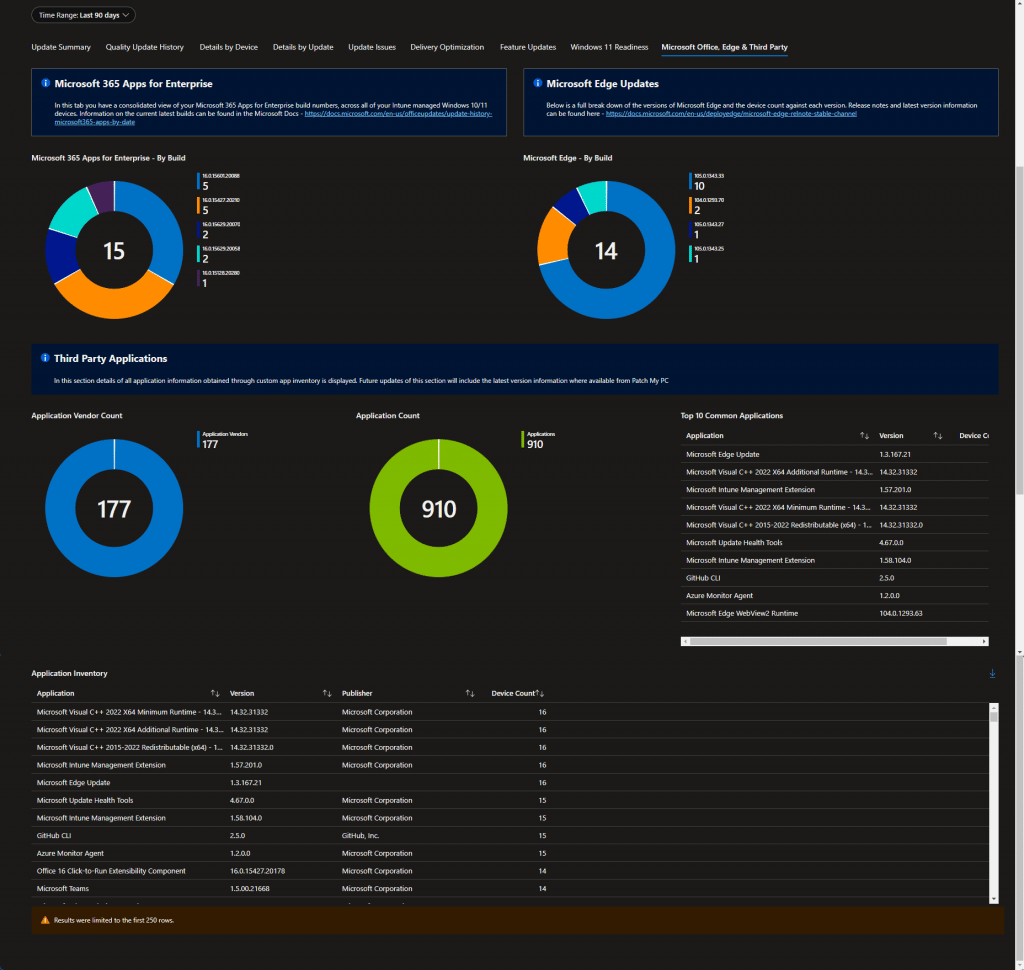
We are currently looking to integrate this tab with third party solution feeds from vendors such as Patch My PC and Scappman.
The Workbook
Want to use this workbook in your environment? No problem. Its available on our GitHub here – Reporting/UpdateComplianceV8.json at main · MSEndpointMgr/Reporting (github.com)
Simply copy the code and follow the below to create the workbook in your environment;
Azure Portal Option
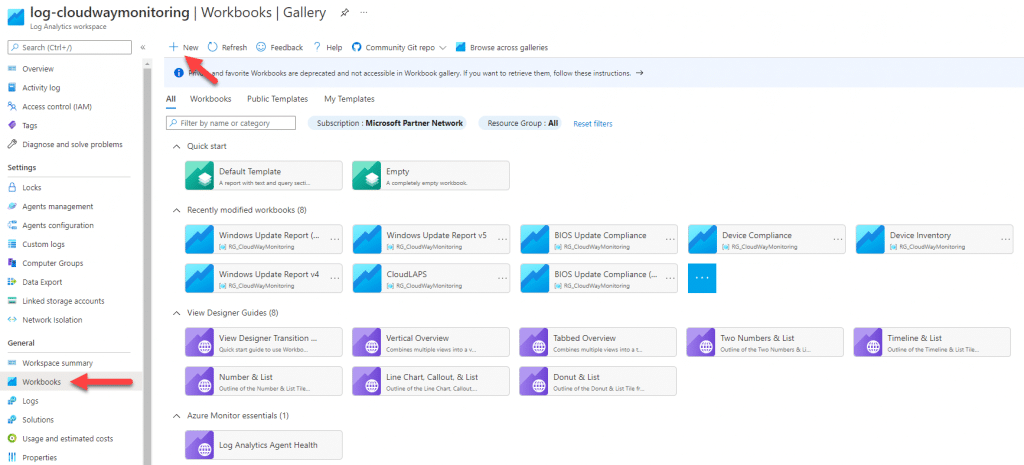
- Log into the Azure Portal – https://portal.azure.com
- Select the Resource Group where your Logs are being sent through to
- Click on Workbooks, then click on the “+ New” button
Endpoint Manager Admin Center Option
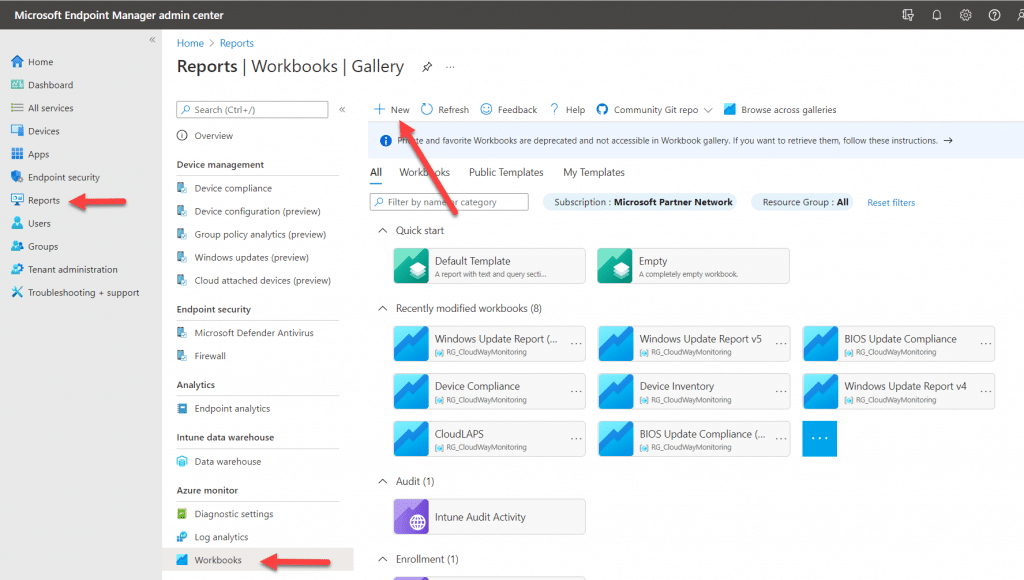
- Log into the Endpoint Manager Admin Center – https://endpoint.microsoft.com
- Click on Reports – Workbooks
- Click on Workbooks, then click on the “+ New” button
- Click on the code button “</>”
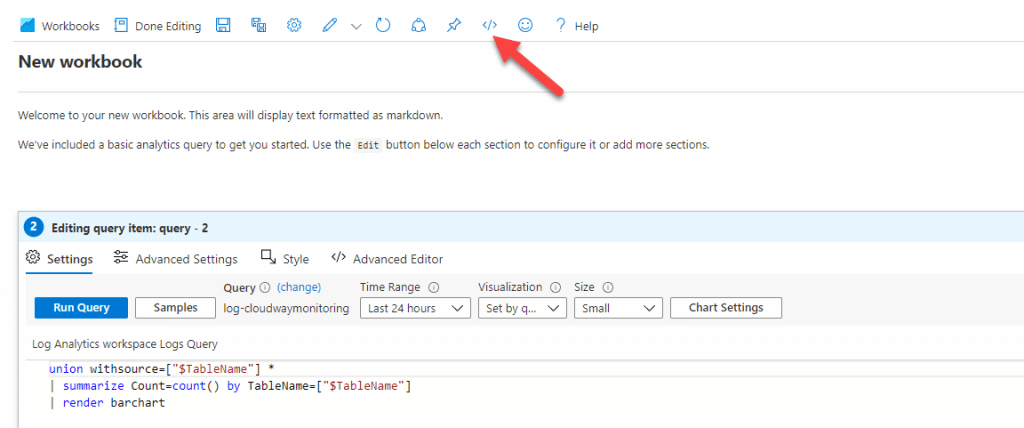
- Paste in the JSON code obtained from our repo and click “Apply”

- Click on the “Save” icon and give your workbook a name;

Other Log Requirements
As we only want to see data from live devices, some elements of workbook use the Intune diagnostic logs (IntuneDevices) to check the last check in date. Therefore you should also link the Intune Diagnostic logs workspace if this is separate, or configure this from scratch if you don’t already have it done (more info here – https://learn.microsoft.com/en-us/mem/intune/remote-actions/collect-diagnostics
Conclusion
One of the main complaints from those coming from a Configuration Manager background is around reporting. Its a fair point, however, utilising several sources such as Intune diagnostic logs, Update Compliance logs, and going custom for your hardware and apps, you can provide high quality dashboards. More to come on the blog soon…





This is awesome!