

Azure Sentinel is a powerful security information and event management (SIEM) platform, but as organizations scale, large amounts of data can quickly lead to high operational costs.
For Security/Intune admins using the Defender XDR Connector with Azure Sentinel, a common cause of excessive event ingestion can be Win32 App Detection and Requirement scripts. These scripts are evaluated every 24 hours on each device for required apps. This frequent evaluation can lead to a significant increase in event volume, especially when targeting large numbers of devices with several hundred Intune Win32 app update policies.
In this blog, we will explore how admins can optimize Azure Sentinel log ingestion by identifying and filtering unnecessary events generated by Intune Win32 App Detection and Requirement scripts. We’ll also encourage you to consider the trade-offs between reducing ingestion costs and maintaining visibility into critical events within your organization.
Remember – Just because there is cheese on the cheese board – you don’t have to eat it!
Extent of the Problem
The Intune Management Extension (IME) executes scripts for Win32 app detection and requirement evaluation every 24 hours as part of its Global Retry Scheduler (GRS). This ensures that all required apps targeted to a device are regularly re-evaluated, regardless of whether their state has changed. When apps rely on both detection and requirement scripts, the volume of executed scripts increases significantly. Each script execution generates events that can lead to higher data ingestion into Azure Sentinel, particularly when devices are targeted with numerous Win32 app update policies. This compounding effect can create substantial noise in event logs and drive up operational costs.
The scale of script execution overhead becomes apparent when considering a typical scenario:
- 200 Win32 apps are deployed as required.
- Each app includes both a Detection Script and a Requirement Script.
- This results in 400 script executions per day per device.
Now, let’s assume a modest deployment of 10,000 devices:
- This leads to a potential maximum of 4 million script execution events per day.
- If only 70% of devices are online, that still results in 2.8 million events daily.
Even with a conservative estimate of 10 million script executions per week, this scales to 40 million executions per month. This volume becomes more significant when factoring in how the Defender XDR Connector captures both process events (e.g., PowerShell executions) and file events (e.g., scripts downloaded by the IME and saved to disk).
We can quickly see how the total number of events is amplified and ingested into Azure Sentinel! More events = more $$$
Admins can determine if they are affected by excessive log ingestion by analyzing the DeviceProcessEvents and DeviceFileEvents tables in Azure Sentinel. These tables often become “noisy” due to the frequent execution of detection and requirement scripts by the Intune Management Extension (IME). Script execution is brokered by the AgentExecutor.exe process which in-turn invokes powershell.exe.
To identify if this is contributing to high ingestion volumes, you can run the following query in the DeviceProcessEvents table
Am I burning cash?
Click bait heading….
While cost is an important consideration, it should not outweigh the critical importance of security. Every event logged can provide valuable insights – especially in scenarios where a nefarious app or malicious script is deployed via Intune. In such cases, we would want every available detail to detect and respond effectively to the threat.
Nonetheless, we want to dig in a little here – after all, we got this far in the blog post right?
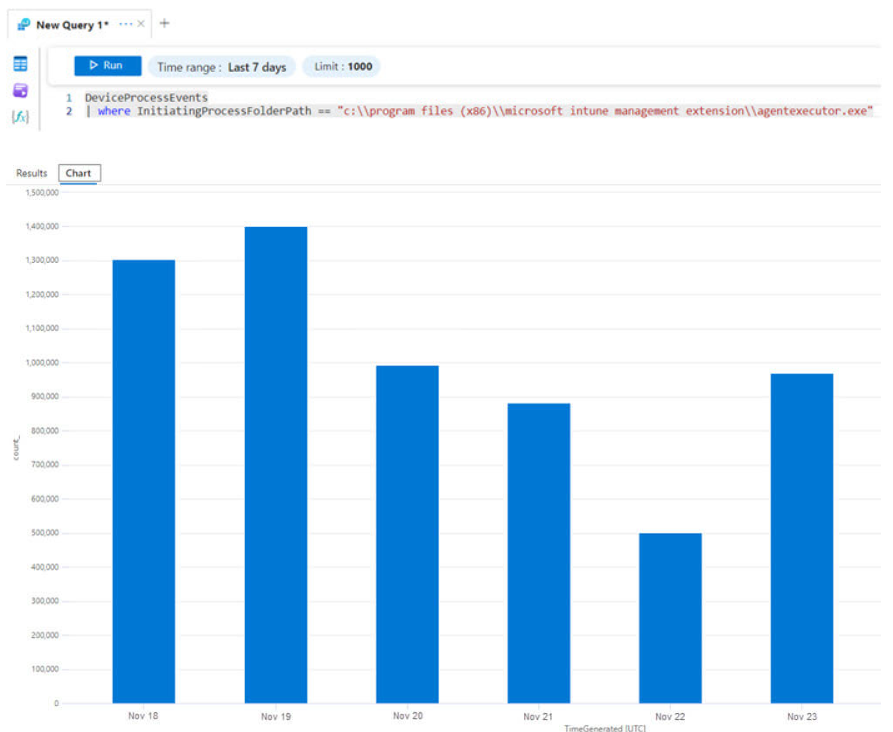
Using DeviceProcessEvents with the InitiatingProcessFolderPath filter in our KQL qeury is useful for isolating specific processes that originate from AgentExecutor. You may see excessive events when you run the following query against the DeviceProcessEvents table.
DeviceProcessEvents | where InitiatingProcessFolderPath == "c:\\program files (x86)\\microsoft intune management extension\\agentexecutor.exe"
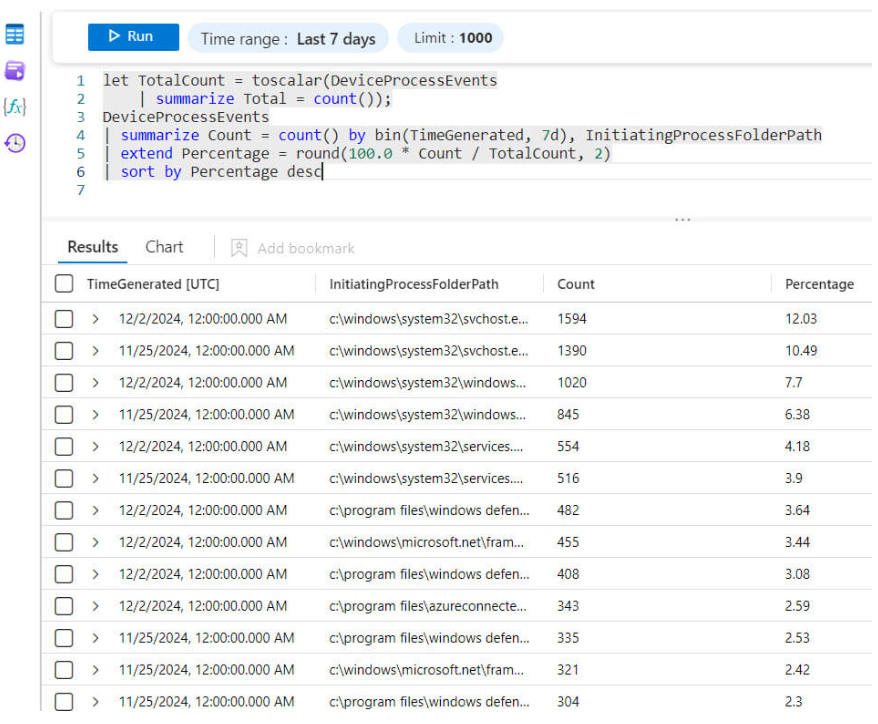
The following KQL query provides a summary of the frequency and relative impact of events logged in the DeviceProcessEvents table, categorized by their originating InitiatingProcessFolderPath. By calculating the total number of events, breaking them down into weekly bins (bin(TimeGenerated, 7d)), and computing the percentage of total events each folder path contributes, you can identify which processes dominate event generation.
Heck, you might even spot a different process burning your cash.
let TotalCount = toscalar(DeviceProcessEvents
| summarize Total = count());
DeviceProcessEvents
| summarize Count = count() by bin(TimeGenerated, 7d), InitiatingProcessFolderPath
| extend Percentage = round(100.0 * Count / TotalCount, 2)
| sort by Percentage desc
Note: I did not have access to a problematic dataset at the time of writing this blog, so the image below is for illustrative purposes only and does not accurately reflect the impact of the events discussed in this blog.
Saving Cash
Click bait heading 2….
Data transformations can be applied to Azure Sentinel in the form of a Data Collection Rule (DCR) to exclude specific events from ingestion, potentially lowering costs by reducing the volume of logged data. These transformations are applied at the data collection stage, ensuring certain events are filtered out before they enter your workspace.
In the following example we will focus on the DeviceProcessEvents table.
Applying transformations to tables to exclude certain events may have serious security implications. While transformations can help reduce noise and lower the cost of Azure Sentinel, they also permanently exclude data before it is ingested. Once excluded, the events are irrecoverable, which means they cannot be used for future analysis, threat hunting, or incident investigation.
Ensure you carefully evaluate the impact of any exclusions, and consult with your security team before applying transformations.
1. Log in to the Azure Portal.
2. In the search bar at the top of the portal, type Log Analytics workspaces and select it from the results.
3. From the list of workspaces, locate the Log Analytics Workspace associated with your Azure Sentinel instance.

4. From the left-hand menu, under Settings, click on Tables.
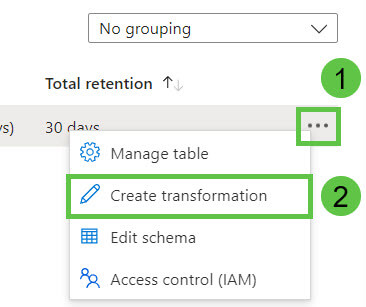
5. Use the search bar to find the DeviceProcessEvents table.
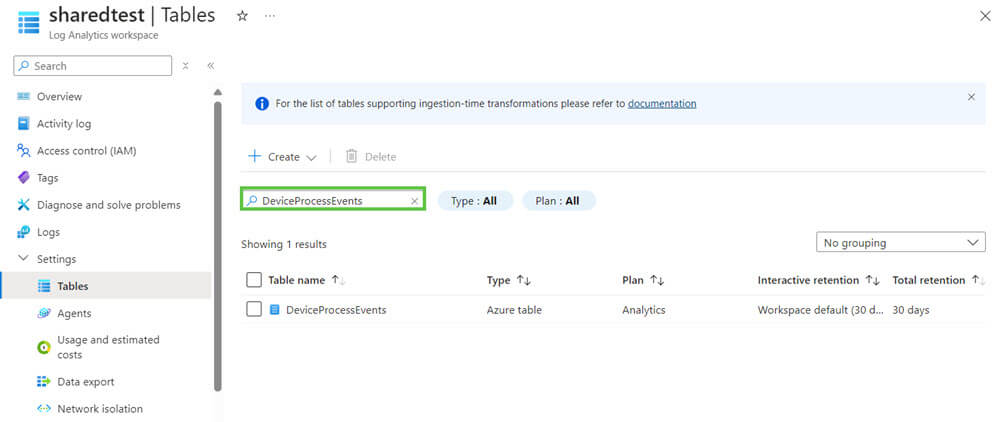
6. Click on the ellipsis (…) and select Create transformation.
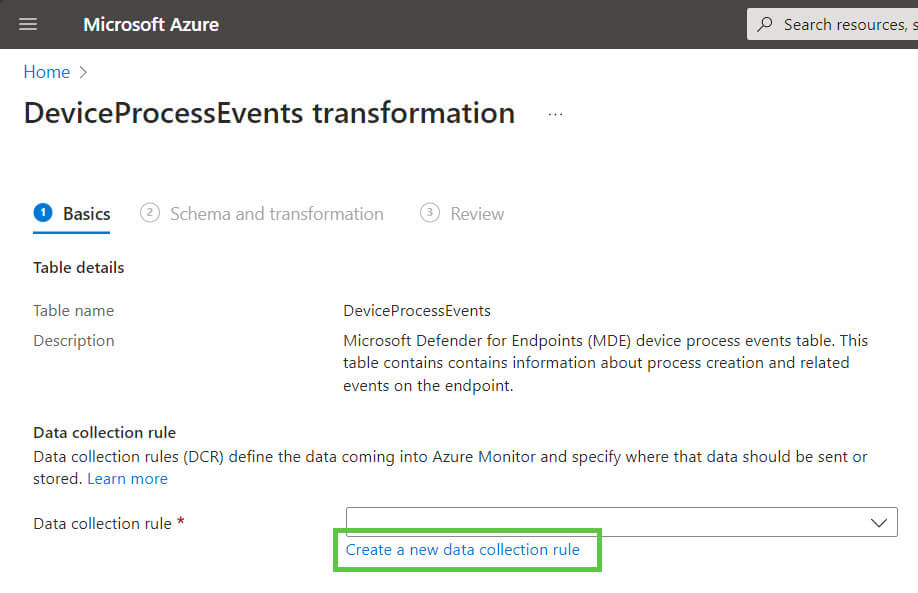
7. Select Create a new data collection rule.
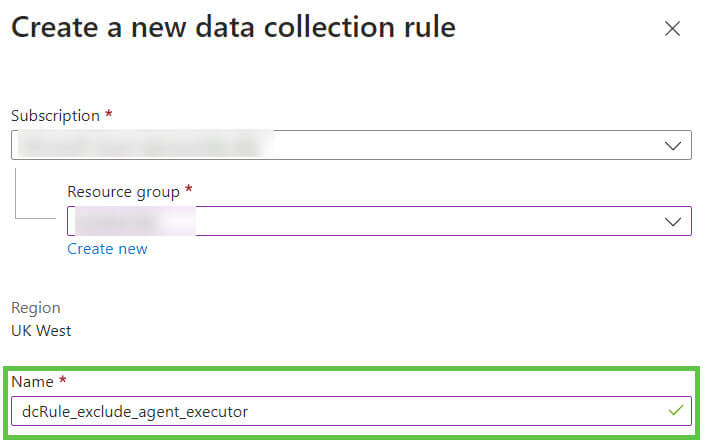
8. Select the desired Subscription and Resource Group to create the data collection rule in. Enter a Name for the rule and click Done.
9. Click Next.
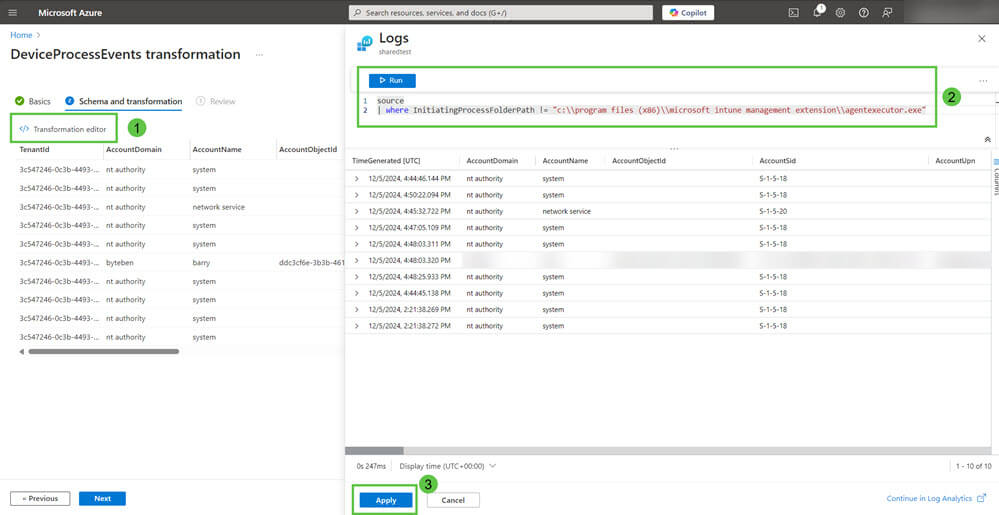
10. Click Transformation Editor and enter the following KQL query in the window.
source
| where InitiatingProcessFolderPath != "c:\\program files (x86)\\microsoft intune management extension\\agentexecutor.exe"
Ensure the query Runs (copying and pasting from WordPress can result in incorrect ASCII chars being pasted) and then click Apply.
11. Click Next and on the summary review screen, click Create.
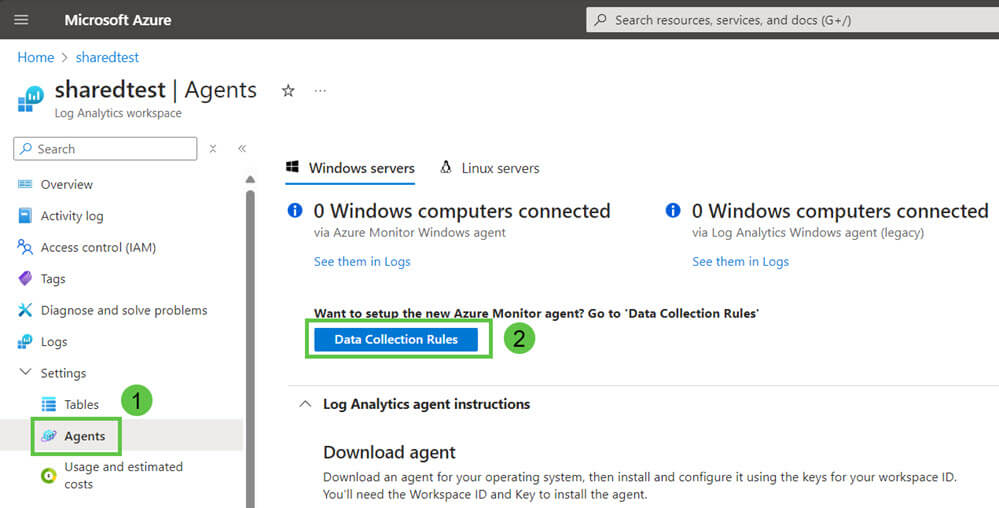
Note: You can find data collection rules used on table transformations by navigating to Agents > Data Collection Rules from the Log Analytics workspace.
While transformations themselves don’t incur direct costs, some scenarios can result in additional charges, as per:- https://learn.microsoft.com/en-us/azure/azure-monitor/essentials/data-collection-transformations#cost-for-transformations
Fortunately, if Azure Sentinel is enabled for the Log Analytics workspace, there’s no filtering ingestion charge regardless of how much data the transformation filters.
If you are seeking additional savings, it might also be worth understanding if you can apply transformations to other tables. Specifically, monitoring when the IME creates detection scripts on disk might not be of value but it can result in large event data when targeting hundreds or thousands of required apps to devices.
On the DeviceFileEvents table, you could apply the following DCR.
source |
where FolderPath !startswith "C:\\program files (x86)\\microsoft intune management extension\\content\\detectionscripts"
I made a mistake, I want to remove those DCRs
There is no obvious place to remove a DCR from a table in the Log Analytics workspace once it has been applied. To do so, we need to delete it from the Data Collection Rules service.
1. In the Azure portal, navigate to Data Collection Rules

2. Select the DCR to remove and click Delete.

Note: Any events already filtered by the DCR are not recoverable.
Summary
While it is possible to use DCRs to filter out unnecessary events and reduce costs, such as those generated by the IME during script evaluation for required Win32 apps, it is essential to carefully consider the implications of doing so.
These transformations permanently exclude events before they are ingested, meaning the filtered data will be irrecoverable for future analysis, threat hunting, or investigations. Excluding events without a thorough understanding of their potential security value could unintentionally compromise your ability to monitor threats or meet compliance requirements.
To mitigate these risks, thoroughly test and evaluate the impact of any data collection rules before applying them. Additionally, consult with your security team! The last thing you want is to save a few bucks only to miss that single event that could’ve led you to patient zero.


Add comment