


 Maurice Daly
Every so often a problem lands on your desk that looks simple and turns out to be a labyrinth. You go in expecting a quick fix, and days later you are still pacing dark corridors, stepping round traps and following clues that lead nowhere. This is the story of one of those: File Explorer grinding to a halt inside a OneDrive folder, and the hunt for what was really going on underneath. OneDrive was in the frame from day one, but it was not the culprit.
The quest begins: something is not right here
The machine at the centre of this story was no underpowered laptop. In this case it was a Windows 11 workstation with 32 logical processors and 128 GB of RAM, running the OneDrive for Business client (26.212.1029.0006) with Files On-Demand enabled and Known Folder Move redirecting Desktop, Documents and Pictures into OneDrive. A perfectly ordinary managed device, just with more horsepower than most.
And yet opening the Documents folder had become an act of faith and patience, as I ended up waiting anywhere from 2 seconds to nearly a minute for things to actually be usable;
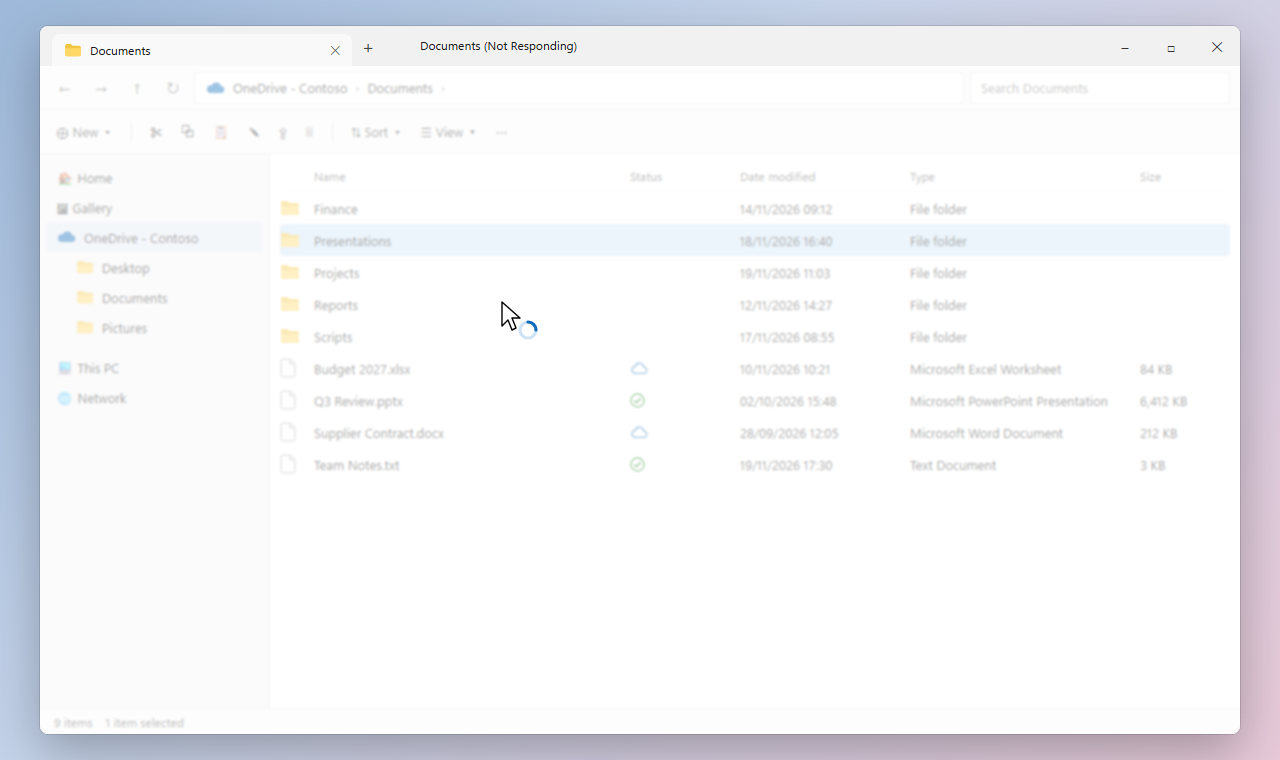
The above screen is a mock up for demonstration purposes
Click into a folder inside the OneDrive sync root and Explorer would freeze. The window frosted over, the title bar gained the dreaded “(Not Responding)” suffix and the cursor spun. Sometimes it recovered; sometimes it stayed stuck long enough for Windows to give up and close it.
The other funny thing is, this was not happening on other devices with the same content synced..
The clues on the walls
Once we started paying attention, the signs were everywhere. In the Details view, every file had its familiar OneDrive status glyph: the cloud for online-only, the green tick for locally available. The folders sat blank, or showed a sync arrow that never went away. Files were fine, folders were not. That asymmetry turned out to be one of the most important clues of the whole expedition, although we did not appreciate it at the time.
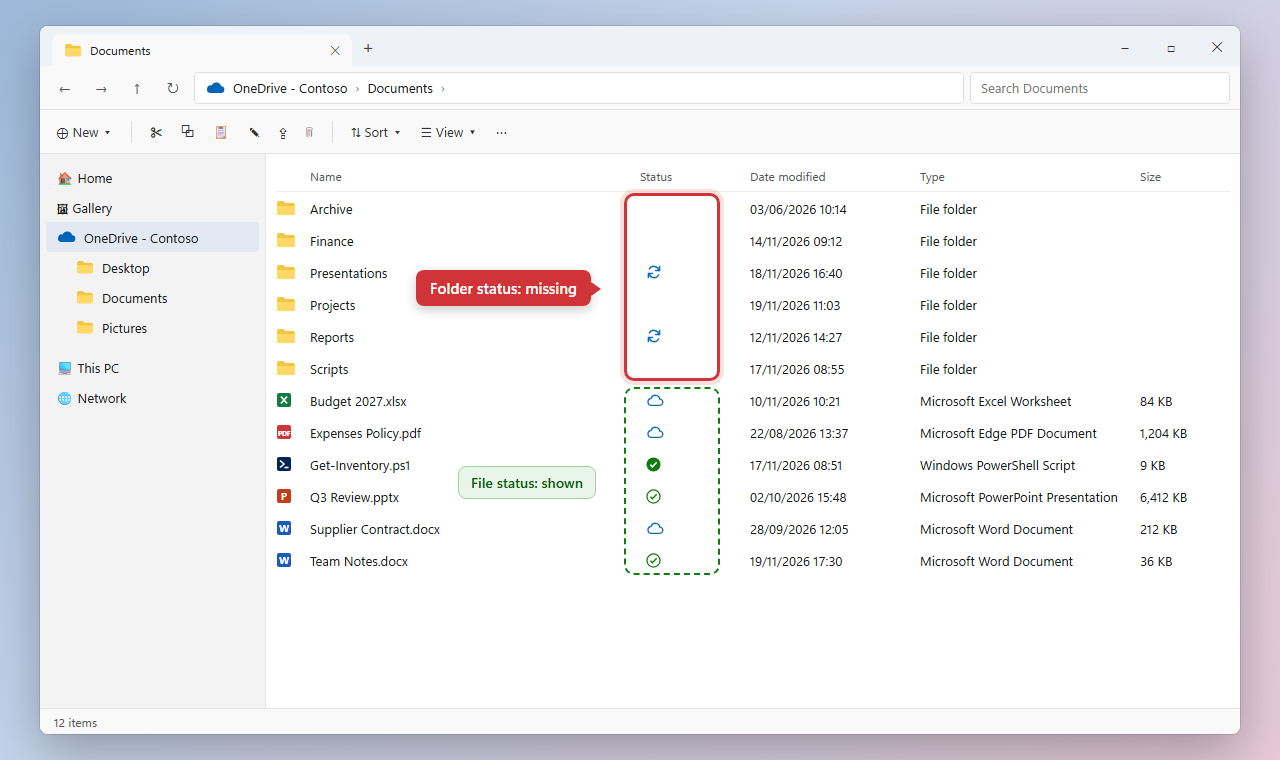
The above screen is a mock up for demonstration purposes
CPU spikes when browsing… Er.. What..
Task Manager told its own story. The OneDrive process sat at roughly 10% of a core continuously, even when nothing appeared to be syncing, and CPU usage jumped every time we browsed into a folder. On a 32-thread machine, listing a few dozen items should not do that.
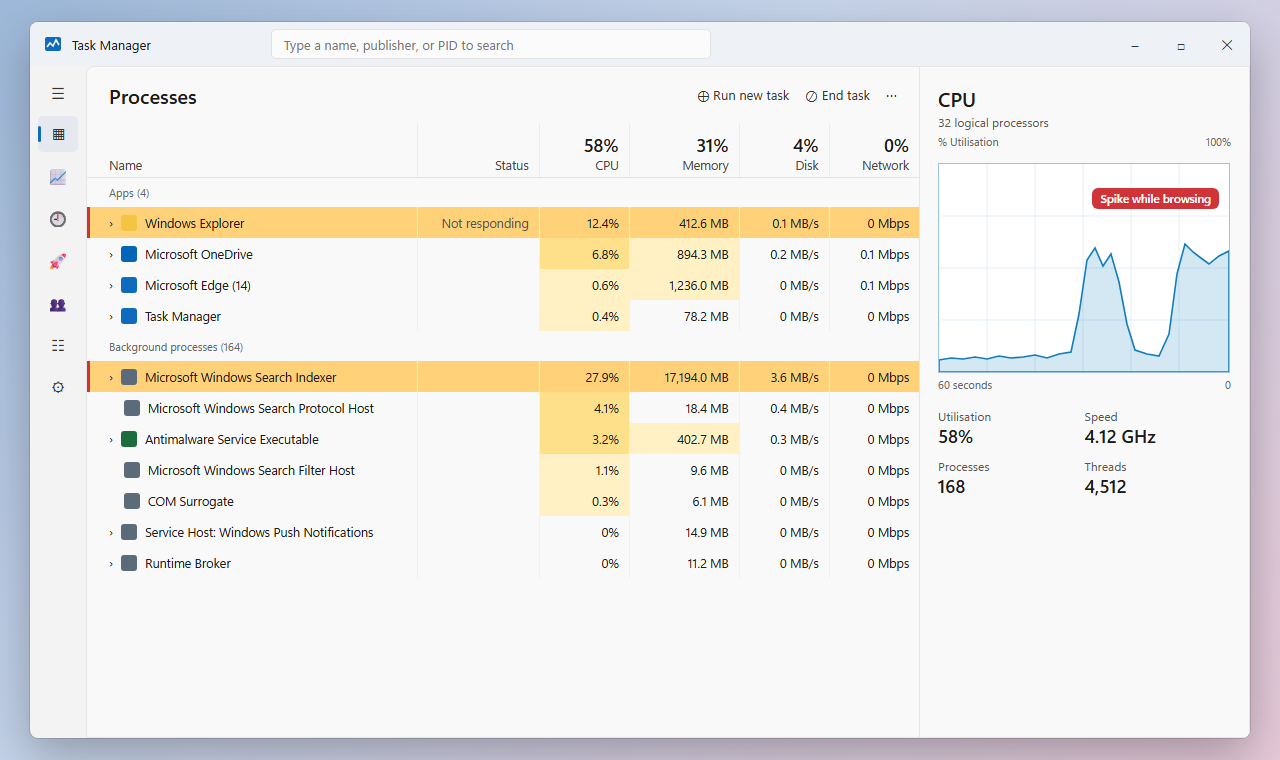
The above screen is a mock up for demonstration purposes
The event logs gave some clue with application event 1002 kept appearing: “explorer.exe stopped interacting with Windows and was closed”. The interesting part was the hang type, recorded as **”Cross-thread;Cross-process”**. Explorer was not busy doing work of its own, it was waiting on *another process* to answer. That one line was a fragment of the map, pointing away from Explorer and towards whatever it was talking to.
The cost to the person at the keyboard
It is easy to describe a problem like this in event IDs and process names, but the real impact is human.

Each freeze might last a few seconds or the best part of a minute, in exactly the places where work lives. Opening a project folder, saving an attachment, browsing in a Save As dialog: all of it goes through the same shell namespace, and all of it could stall. A problem like this breeds rituals: restarting Explorer from Task Manager, pasting paths into the address bar, leaving a window open rather than risk navigating again. None of them fix anything.
When the freezing only happens in OneDrive folders and the status icons are missing, the conclusion writes itself: “sync is stuck”. People start wondering whether their files have really uploaded and keeping local copies “just in case”, precisely the behaviour a managed cloud storage rollout is meant to eliminate.
For whoever supports the device, every symptom points at the OneDrive client: reset it, relink it, sync less. The worst case here is that the helpdesk gets another one of those calls beginning with “My machine is very slow..”. Lets face it, we have all heard this in the past, even if the machine in question was more then capable.
Into the temple: the investigation
Drawing the map: Process Monitor, aimed at OneDrive and Explorer
Process Monitor is the obvious first tool for “Explorer hangs”, but used naively it is a trap of its own.Left wide open on a busy workstation it records millions of events a minute, and the one moment you care about, the freeze, is buried somewhere in the middle.
So rather than click Capture and hope, I wrapped it in a script that does four things: records the scene, narrows the capture, marks the moment and does the first pass of analysis.
What you’ll need before you set out
Process Monitor itself.
It isn’t bundled with the script (Sysinternals licensing doesn’t allow redistribution). Download it from [Microsoft Sysinternals](https://learn.microsoft.com/sysinternals/downloads/procmon) and extract it next to `Invoke-ExplorerHangTrace.ps1`, or point the script at it with `-ProcmonPath`. The script picks `Procmon64a.exe` on ARM64, `Procmon64.exe` on x64 and falls back to `Procmon.exe`. No installation is needed; the EULA is accepted for you with `/AcceptEula`.
Administrator rights
Procmon loads a kernel driver, so the script relaunches itself elevated (expect a UAC prompt). Analysing an existing capture with `-AnalyzePml` doesn’t need elevation.
No other Procmon session
The script runs `Procmon /Terminate` before and after the capture, which **closes any Procmon window already open**
Your Procmon settings are backed up and restored.
A driver your security stack allows
Procmon extracts and loads its own signed driver at runtime. Strict application control (WDAC/App Control) or some EDR products may block it; if the capture never starts, check there first.
Disk space outside OneDrive
Raw captures can run to hundreds of megabytes or more, and the CSV conversion roughly doubles that. The default output folder is `C:\ExplorerHangTrace`; keep it off synced folders.
Symbols, only if you want call stacks
The CSV analysis doesn’t need them. To inspect stacks in the raw PML (`-IncludePml`), Procmon uses Windows’ `dbghelp.dll` and the Microsoft public symbol server, so internet access is required.
Now with those met.. lets continue..
- Record the scene before touching anything. Before Procmon starts, the script takes a snapshot of everything that could plausibly sit between Explorer and a OneDrive folder:
- OneDrive client version and process state, and the user’s OneDrive accounts and sync folders
- The sync roots registered with the Cloud Files API (`SyncRootManager`), the layer Explorer and OneDrive use to talk about placeholders and status
- File system minifilter drivers (`fltmc filters`), antivirus roducts, mapped drives and the Windows Search service;
- Non-Microsoft shell extensions registered with Explorer
- Cash and hang events from the Application log for the last 14 days: event **1000** (application error, i.e. a crash) and event **1002** (application hang) for `explorer.exe`, `OneDrive.exe`, `FileCoAuth.exe` and `dllhost.exe`. This is where the “Cross-thread;Cross-process” hang type first surfaced.
- Narrow the capture to the shell and its helpers.
The script loads its own Procmon configuration with two important additions to the default columns:- **Duration**, so slow operations can be measured rather than guessed
- **Thread ID**, so individual Explorer threads can be followed
- In the default *Focused* mode it keeps only the processes involved in browsing a OneDrive folder: `explorer.exe`, `OneDrive.exe`, `OneDrive.Sync.Service.exe`, `FileCoAuth.exe`, `dllhost.exe`, `prevhost.exe`, the Windows Search processes (`SearchIndexer.exe`, `SearchProtocolHost.exe`, `SearchFilterHost.exe`), `RuntimeBroker.exe` and Microsoft Defender. It also drops Procmon’s own activity and NTFS metadata noise such as `$Mft` and `pagefile.sys`, and discards filtered events rather than storing them.
- A *Full* mode is available if a third-party agent is suspected. Procmon runs minimised to a backing file, and your own Procmon settings are backed up and restored afterwards.
- Mark the moment explorer hung. While the capture runs, the user simply works as normal. The instant Explorer freezes, or as soon as it recovers, they press **H**, and the script records a timestamped hang marker. **S** stops the capture. Those markers are what turn a haystack of events into a handful of short windows worth reading.
- Do the first pass of analysis. The script converts the PML file to CSV and works through it looking for:
- Slow operations: anything taking 500 ms or more, per process and per path.
- Explorer thread stalls: any Explorer thread that goes silent for 2 seconds or more and then resumes, with the last operation before the silence and the first one after it.
- Activity around each marker: every operation of 50 ms or more that overlaps the 20 seconds before each **H** press.
- Errors that matter: sharing violations, timeouts, network failures and the `CLOUD FILE …` results the Cloud Files API returns when OneDrive can’t satisfy a request.
- Cloud Files activity, network (UNC) access and non-Microsoft DLLs loaded into shell processes.
- Waits that are long by design, such as directory change notifications, oplocks and named pipes, are excluded from the duration checks so they don’t swamp the results. Everything is written to CSV files and a readable summary, then zipped for review:
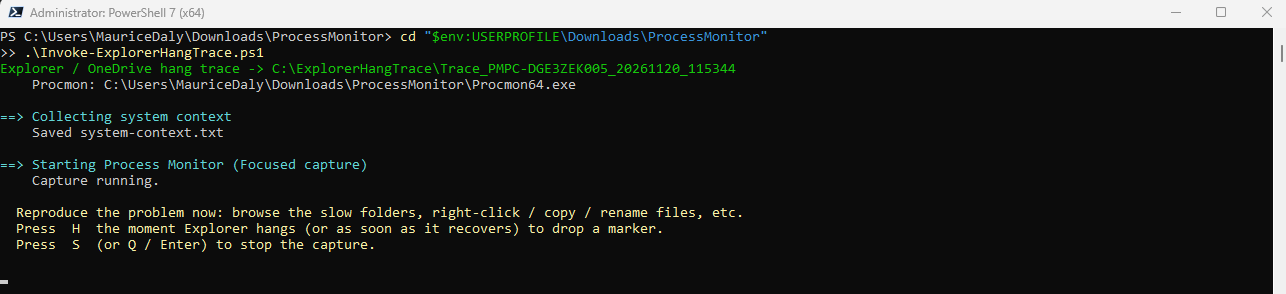
Focused capture (default): press H when Explorer hangs, S to stop
.\Invoke-ExplorerHangTrace.ps1
Capture every process, stop after 3 minutes, keep the raw PML for call stacks
.\Invoke-ExplorerHangTrace.ps1 -CaptureMode Full -DurationSeconds 180 -IncludePml
The Output
system-context.txt
The scene: OneDrive version, sync roots, filter drivers, AV, shell extensions, recent crash/hang events.
explorer-thread-stalls.csv
Explorer threads that went silent, and what they did either side of the silence.
activity-near-markers.csv
Everything slow in the 20 seconds before each hang marker.
slow-operations*.csv
Every operation over the slow threshold, raw and grouped
cloud-files-activity.csv, non-success-results.csv
Cloud Files API traffic and error results.
third-party-modules-in-shell.csv, network-paths.csv
Non-Microsoft DLLs in Explorer, and any UNC access.
There is one limitation worth knowing before you set out. Procmon sees file system, registry, process and network activity; it does **not** see a thread blocked on a COM or ALPC call to another process. When Explorer hangs waiting for someone else, the trace doesn’t show a slow operation. It shows an Explorer thread that simply stops, then carries on as if nothing had happened. In this hunt, that silence turned out to be the most important clue of all.
Trap one: the trace that looked innocent
The capture mostly told us what was *not* wrong. Explorer’s disk I/O was quick, under 20 ms per operation; when it froze, it simply went quiet, waiting. Over six minutes there were around 1.3 million registry reads, many of them checking whether a path belonged to a sync root. Busy, but not blocked.
One by one the usual suspects were ruled out:
- Microsoft Defender was active, but none of its operations were slow.
- Network shares were never touched.
- Third-party shell extensions (a screen capture tool, an archiver, a GPU driver extension) were loaded but did not line up with the hangs.
There was also a booby trap of our own making. The first version of the trace script wrote its log, 500 MB and more, to the Desktop. With Known Folder Move, the Desktop lives in OneDrive, so the trace was generating the very sync load we were trying to measure. Its default output now goes to `C:\ExplorerHangTrace`, well away from anything synced.
Trap two: blame the sync engine
An earlier clean-up that moved a large number of developer files out of OneDrive, taking the synced file count from around 159,000 to around 56,000, helped but did not cure the problem. OneDrive’s `SyncDiagnostics.log` confirmed the clean-up had been processed (86,402 file deletes and 7,935 folder deletes) and showed `ChangesToProcess = 0` and `syncStallDetected = 0`. Sync was idle and healthy. Explorer still hung.
Trap three: the handle count
OneDrive.exe was holding around 88,000 handles. That looks alarming, but the number was stable rather than climbing. Not a leak; another false lead.
The hidden chamber: folder status
Procmon showed Explorer *waiting*, so the question became: waiting for what? I stopped watching Explorer and started imitating it. The `Shell.Application` COM object uses the same shell namespace as Explorer, so we could ask for exactly what Explorer asks for and time it.
Plain enumeration was fine: 114 items in OneDrive\Documents came back in 152 ms. The interesting part was `System.StorageProviderUIStatus`, the property behind the OneDrive status icon and the Status column:
$shell  = New-Object -ComObject Shell.Application

$folder = $shell.Namespace("$env:OneDriveCommercial\Documents")

foreach ($item in $folder.Items()) {

    $sw = [Diagnostics.Stopwatch]::StartNew()

    $null = $item.ExtendedProperty('System.StorageProviderUIStatus')

    $sw.Stop()

    '{0,-6} {1,8} ms  {2}' -f ($(if ($item.IsFolder) {'Folder'} else {'File'})), $sw.ElapsedMilliseconds, $item.Name

}
Files answered in 3-11 ms. Folders took between 2,180 ms and 48,346 ms **each**, and one never returned at all. Every one of the 24 folders measured was slow. That single result explained both headline symptoms: the blank status icons next to folders, and an Explorer window that stopped responding while it waited for them.
A probe process stuck on one of those folders showed a thread in `Wait:LpcReply` (waiting on a reply from another process), with `Windows.Storage.Search.dll` and `cldapi.dll` loaded. That matched the cross-process hang type in event 1002, and the DLL name hinted at where to dig next.
The real treasure: the Windows Search index
Here is the part that is not obvious.
A file’s OneDrive status is a property of that one file, so it is cheap to read. A *folder’s* status is a summary of everything beneath it: is anything inside still uploading, in error or online-only? For cloud files sync roots, Windows aggregates that summary through **Windows Search** rather than walking every file in the tree. If the index answers slowly, every folder status in view waits for it, and so does Explorer.
So we went straight to the indexer with an ADODB query against `SYSTEMINDEX` (provider `Search.CollatorDSO`). Each query took 2,706-3,448 ms, even when scoped to Downloads, which is not in OneDrive at all. A healthy index answers the same query in around 100 ms. The problem was not OneDrive; it was the index underneath it.
The indexer itself confirmed it. SearchIndexer.exe was using around 17 GB of memory (17,194 MB) only about 2.5 hours after the service had started. On disk, `Windows.db` in `C:\ProgramData\Microsoft\Search\Data\Applications\Windows` was 1,651 MB, with `Windows-gather.db` at 160 MB: 1,817 MB in total.
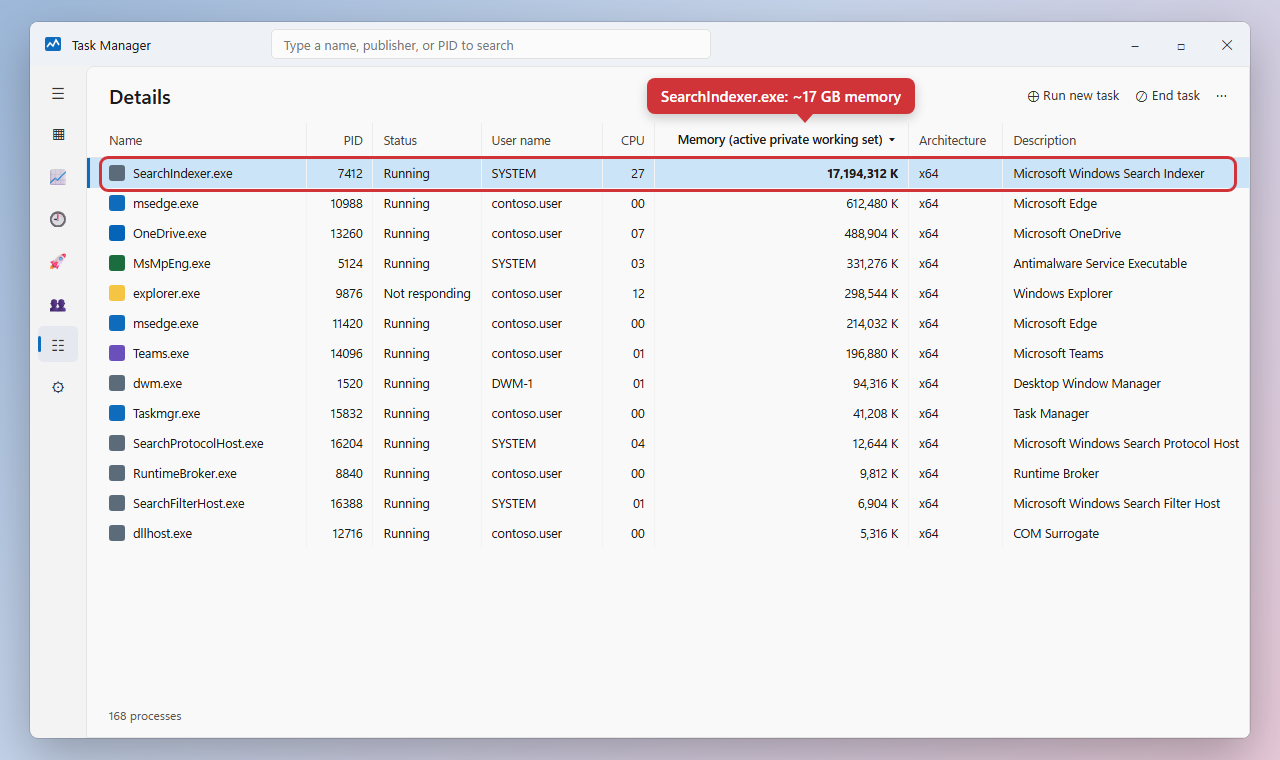
Mock-up: Task Manager Details tab for a fictional Contoso user, with SearchIndexer.exe holding around 17 GB. The memory figure reflects the real investigation; PIDs and other values are illustrative.
This also gives a plausible explanation for the CPU spikes: every folder Explorer draws in a sync root needs a status, and every one of those lookups lands on an indexer that was already struggling.
Claiming the treasure: rebuilding the index
The fix was to rebuild the Windows Search index. From an elevated PowerShell prompt:
- Stop the Windows Search service: `Stop-Service WSearch`. Be patient; ours took over a minute to stop.
- Tell Windows to rebuild on next start: set `SetupCompletedSuccessfully` to `0` under `HKLM:\SOFTWARE\Microsoft\Windows Search`.
- Delete the contents of `C:\ProgramData\Microsoft\Search\Data\Applications\Windows` (check the `DataDirectory` value in the same registry key if the index has been moved).
- Start the service again: `Start-Service WSearch`.
Windows then re-indexes in the background. Expect Windows Search results (Start, Explorer, Outlook) to be incomplete for anything from a few minutes to a couple of hours.
Before and after
Results speak for themselves, so I’ll leave you to look over them..
| Test | Before | After |
| Windows Search query (TOP 50, Downloads) | 2700ms | 107ms |
| Status of 82 folders in Documents | 2-48 s each, one never returned | 472 ms total (max 20 ms) |
| Desktop (4 folders) | – | 34 ms total |
| SearchIndexer memory | 17GB | 40MB |
Folder status lookups went from seconds, or forever, to milliseconds. With nothing left to wait for, the folder icons appear promptly alongside the files, and the cross-process call Explorer had been blocking on now answers almost instantly.
Standing guard: keeping Windows Search pruned with Intune
Rebuilding one index by hand is a fix. Making sure no index in the estate quietly grows back into a 17 GB chamber is upkeep, and that is what the Remediation pair is for. Think of it as keeping the vines cut back: every device is checked on a schedule, healthy ones are left alone, and only an index that has become bloated or slow is rebuilt.
How the loop works
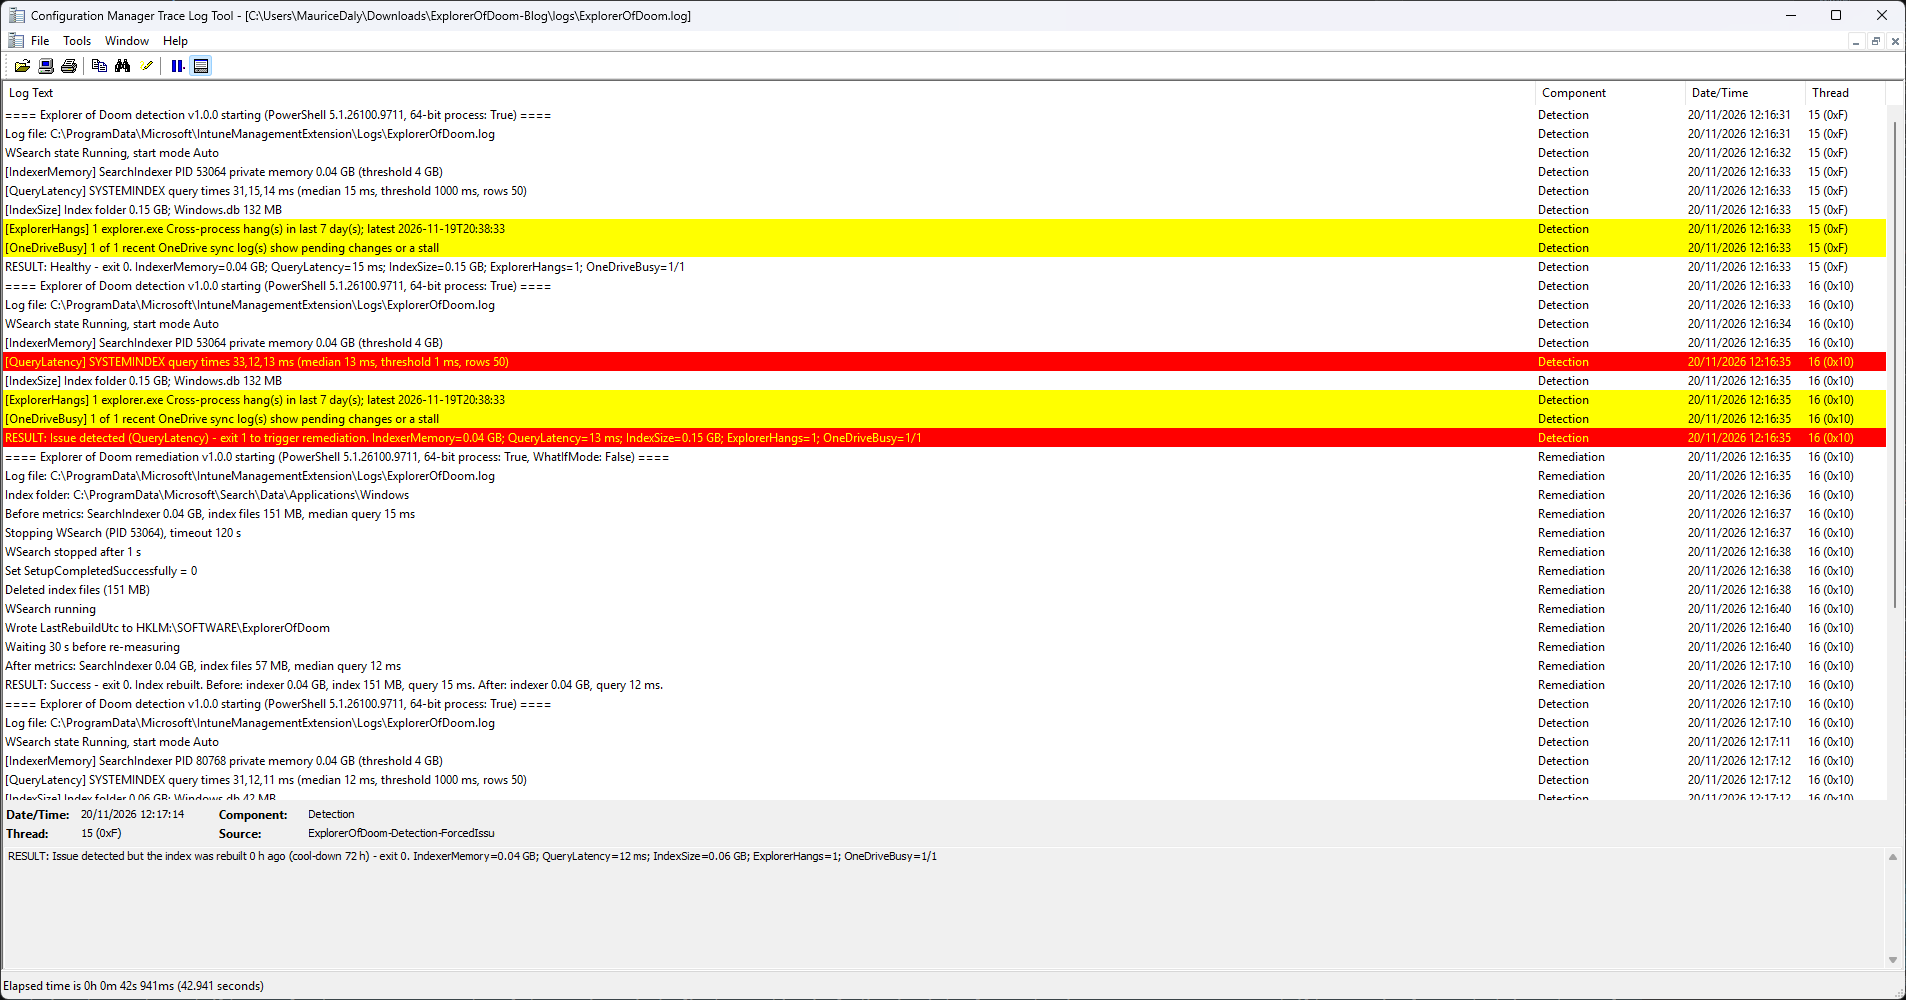
- Detect on the schedule you set. A healthy device exits 0 and nothing happens; the run costs a couple of seconds.
- Remediate only when the SearchIndexer is above `$MemoryThresholdGB`, or Windows Search queries are slower than `$QueryThresholdMs` or time out.
- Detect again. Intune re-runs detection straight after remediation. The fresh index is small and fast, and the cool-down marker written by the remediation keeps it from asking for a second rebuild while the new index fills, so the device reports as fixed.
- Hold off for `$RebuildCooldownHours` (72 by default). If the device is still unhealthy after that, it is rebuilt again, and that repeat tells you something (see below).
Rolling it out
Start in report-only mode. Deploy with `$WhatIfMode = $true` in the remediation script to a pilot group. Detection still reports which devices are unhealthy and why, and the remediation logs what it *would* do without touching anything. It is a cheap way to find out how many of your devices are already in the temple.
Then enable the rebuild for the pilot, and finally for everyone. All the thresholds live in the detection script; the remediation simply acts on its verdict, so tune them in one place.
Schedule it daily, outside core hours. While an index rebuilds, Start menu, Explorer and Outlook search results are incomplete for a while. A run at the end of the working day keeps that out of people’s way, and missed runs catch up when the device is next online. More frequent runs add little: devices fetch Remediation policy roughly every eight hours, and the cool-down limits rebuilds anyway.
Give the service desk a direct option. For a user who is stuck *now*, **Run remediation (preview)** on the device’s page in the Intune admin center runs the package on demand, without waiting for the schedule.
Tuning the thresholds
The defaults (4 GB of indexer memory, 1,000 ms per query) are deliberately conservative: our unhealthy device was at 17 GB and around 3 seconds, while a healthy index answered in about 100 ms. Devices with very large mailboxes or heavily indexed file shares can legitimately run a bigger index, so check the exported report before lowering anything. Raise `$IndexSizeWarnGB` if large indexes are normal for you; it only adds a warning to the log.
Where the scripts write: log and registry locations
Contained within the detection and remediation scripts are defined locations at the top of each script. The block is deliberately identical in both, because detection and remediation share a log and a registry marker. If you change a value, change it in both scripts.
`$LogFolder` | `%ProgramData%\Microsoft\IntuneManagementExtension\Logs`
Folder for the CMTrace log. The default sits alongside the Intune Management Extension logs, so **Collect diagnostics** picks it up automatically. Point it anywhere SYSTEM can write, for example a central `C:\ProgramData\<YourOrg>\Logs`.
`$LogFileName` | `Detect-ExplorerOfDoom.log`
One log shared by both scripts, so a detect, remediate and re-detect cycle reads as a single timeline in CMTrace (filter on the `Detection` or `Remediation` component).
`$MaxLogSizeMB` | `4`
When the log passes this size it is rolled over to `ExplorerOfDoom.lo_`, the same convention Configuration Manager uses, and a fresh log is started.
`$MarkerRegistryKey` | `HKLM:\SOFTWARE\ExplorerOfDoom`
Written by the remediation after a successful rebuild: `LastRebuildUtc` (ISO 8601 UTC timestamp) and `LastRebuildBefore` (indexer memory, index size and query time before the rebuild). Detection reads `LastRebuildUtc` to enforce the cool-down. Rename it to sit under your own organisation’s key if you prefer. |
`$WindowsSearchRegistryKey` | `HKLM:\SOFTWARE\Microsoft\Windows Search`
Microsoft’s Windows Search configuration key. The scripts read `DataDirectory` to find the index (so a relocated index is handled) and the remediation sets `SetupCompletedSuccessfully` to `0` to force the rebuild. Leave this alone unless Windows itself changes. |
A few behaviours worth knowing:
- Fallback logging. If `$LogFolder` can’t be created or written to, the scripts log to `%TEMP%\ExplorerOfDoom.log` instead. As SYSTEM, that is usually `C:\Windows\Temp`. A logging problem never stops detection or remediation from running.
- Checking a device by hand. `Get-ItemProperty ‘HKLM:\SOFTWARE\ExplorerOfDoom’` shows when the index was last rebuilt and what it looked like beforehand, which is handy when a user reports that search “went quiet” for a while.
- Resetting the cool-down. Delete the `LastRebuildUtc` value (or the whole key), and the next detection run will evaluate the device from scratch.
- Nothing personal is stored. The log records the account context (`NT AUTHORITY\SYSTEM`), measurements and paths under `ProgramData`. It contains no user names, and the one-line output Intune collects never includes file paths.
Keeping the temple sealed
Now equipped with the ability to actually do work, there are a couple of thing we can look out for;
- Keep OneDrive lean. Large, fast-changing working sets and scratch data belong in a local, non-synced folder. Of course what I am talking about here is ensuring that people such as dev’s don’t use OneDrive for Git synced folders, as storing Git repos in OneDrive synced folders risks repo corruption, locked files, sync conflicts and duplicates, broken online-only files and constant sync traffic. Use Git as intended, with repositories that keep your changes.
- Watch SearchIndexer memory. Several GB is a warning sign; run the script on a schedule or as an Intune Remediation to spot it early.
- Use Indexing Options exclusions where appropriate. If content does not need to be searchable, keep it out of the index rather than letting the index carry it.
- Check the index before blaming the sync client. If folder status is slow while `ChangesToProcess` is 0, look at Windows Search first.
The treasure, recovered
Looking back, the clues were there from the start: Explorer was hanging while it waited on another process, folders never got their status icons, and OneDrive had a solid alibi the whole time. OneDrive wasn’t the problem.
The real culprit was the Windows Search index, which had grown to 17 GB and was making every folder wait its turn. If your users are stuck in their own Explorer of Doom, you can skip the dead ends we went down. Check the size of the search index, time how long a folder takes to show its status, and if the index has grown to gigabytes, rebuild it. Things should feel a lot quicker afterwards.
I hope you find this blog useful, and you’ll find all of the scripts on my GitHub repo here – PowerShell/Intune/ExplorerOfDoom at master · maurice-daly/PowerShell


 Ben Whitmore

 Jose Schenardie




Add comment